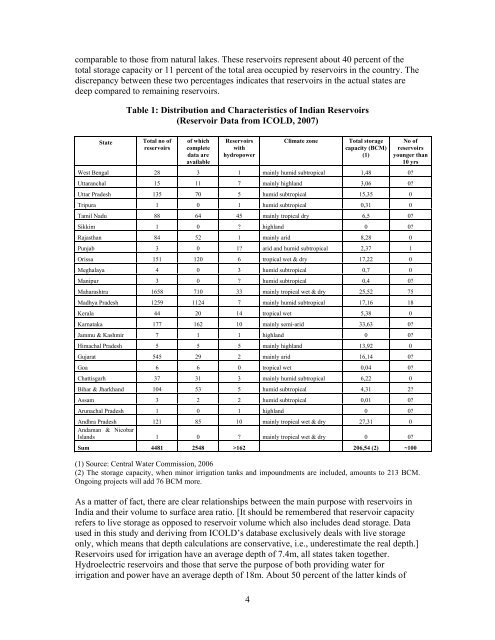
comparable to those from natural lakes. These reservoirs represent about 40 percent of thetotal storage capacity or 11 percent of the total area occupied by reservoirs in the country. Thediscrepancy between these two percentages indicates that reservoirs in the actual states aredeep compared to remaining reservoirs.Table 1: Distribution and Characteristics of Indian Reservoirs(Reservoir Data from ICOLD, 2007)StateTotal no ofreservoirsof whichcompletedata areavailableReservoirswithhydropower4Climate zoneTotal storagecapacity (BCM)(1)No ofreservoirsyounger than10 yrsWest Bengal 28 3 1 mainly humid subtropical 1,48 0?Uttaranchal 15 11 7 mainly highland 3,06 0?Uttar Pradesh 135 70 5 humid subtropical 15,35 0Tripura 1 0 1 humid subtropical 0,31 0Tamil Nadu 88 64 45 mainly tropical dry 6,5 0?Sikkim 1 0 ? highland 0 0?Rajasthan 84 52 1 mainly arid 8,28 0Punjab 3 0 1? arid and humid subtropical 2,37 1Orissa 151 120 6 tropical wet & dry 17,22 0Meghalaya 4 0 3 humid subtropical 0,7 0Manipur 3 0 ? humid subtropical 0,4 0?Maharashtra 1658 710 33 mainly tropical wet & dry 25,52 75Madhya Pradesh 1259 1124 7 mainly humid subtropical 17,16 18Kerala 44 20 14 tropical wet 5,38 0Karnataka 177 162 10 mainly semi-arid 33,63 0?Jammu & Kashmir 7 1 1 highland 0 0?Himachal Pradesh 5 5 5 mainly highland 13,92 0Gujarat 545 29 2 mainly arid 16,14 0?Goa 6 6 0 tropical wet 0,04 0?Chattisgarh 37 31 3 mainly humid subtropical 6,22 0Bihar & Jharkhand 104 53 5 humid subtropical 4,31 2?Assam 3 2 2 humid subtropical 0,01 0?Arunachal Pradesh 1 0 1 highland 0 0?Andhra Pradesh 121 85 10 mainly tropical wet & dry 27,31 0Andaman & NicobarIslands 1 0 ? mainly tropical wet & dry 0 0?Sum 4481 2548 >162 206,54 (2) ~100(1) Source: Central Water Commission, 2006(2) The storage capacity, when minor irrigation tanks and impoundments are included, amounts to 213 BCM.Ongoing projects will add 76 BCM more.As a matter of fact, there are clear relationships between the main purpose with reservoirs inIndia and their volume to surface area ratio. [It should be remembered that reservoir capacityrefers to live storage as opposed to reservoir volume which also includes dead storage. Dataused in this study and deriving from ICOLD’s database exclusively deals with live storageonly, which means that depth calculations are conservative, i.e., underestimate the real depth.]Reservoirs used for irrigation have an average depth of 7.4m, all states taken together.Hydroelectric reservoirs and those that serve the purpose of both providing water forirrigation and power have an average depth of 18m. About 50 percent of the latter kinds of
eservoirs are located in the states mentioned above, where environmental conditions favourlow emissions of carbon gases. As concluded earlier, dissolved methane is rapidly oxidised inoxygenated water. Aerobic conditions, extending to a depth of about 5 m from the watersurface, have proven sufficient for the full elimination of methane before it reaches the watersurface. Therefore, reservoir depth per se is crucial for a reservoir’s potential to emit methane.As seen in Table 1, few reservoirs are younger than 10 years, notwithstanding the ongoingcreation of new reservoirs and the possible time lag between ICOLD’s compilation and thetimetable of reservoir filling. In other words, decomposing flooded vegetation and soilorganic matter probably play a minor role for the overall carbon balance in existing Indianreservoirs.The most potent, but least easily evaluated source of atmospheric methane from Indianreservoirs is probably the degassing of hypolimnetic (=deriving from near the bottom) waterwhen passing the tailrace or downstream river reaches or canals. The significance of thissource is related to the shape of the reservoir, its hydraulics and the design of the reservoiroutlet. While many other contributions of reservoir emissions of greenhouse gases can bededuced from general experience and easily obtained information, estimates of emissions dueto degassing must be based on analyses of complex site-specific information. Suchinformation is currently not available for Indian reservoirs, or for tropical reservoirs in othercountries except for a few intensively studied ones in South America for that matter.4.0 Conclusions and Recommendations/ Suggested Next Steps1. Estimates of greenhouse gas emissions from Indian reservoirs are underway – (see Annex1). These estimates involve a high degree of uncertainty, among other things dependingon the fact that reliable information is available for comparatively few reservoirs. It isclear, however, that previous estimates that have been circulated in the press overstateemissions from reservoirs in India. In particular, hydropower reservoirs are to a largeextent located in regions where natural conditions restrict processes that give rise tomethane emissions. In addition, such reservoirs are deep and old, factors that also reduceemissions of greenhouse gases. In order to allow more precise estimates it is suggestedthat the characteristics of major reservoirs (at least those with a surface area ≥100 km 2 ) beupdated. Data of particular interest are surface area, reservoir length, average depth andrenewal/throughflow rate. These measures allow a simplified analysis of the risk ofstratification of reservoirs, a prerequisite for the formation of anoxic, methane generatingbottom water as emphasised by Ledec and Quintero in a World Bank report published2003.2. Since methane production is related to the amount of organic matter in reservoirs it is ofvalue to know the size of the catchment upstream from the reservoirs from where theorganic material derives.3. It can be suspected that one of the most important pathways for methane from the water tothe atmosphere is the degassing of water that passes hydropower turbines. Measurementsof methane concentrations near the intake of several power plants should illuminate howimportant this pathway is.5