USF Physicians Group - University of South Florida System
USF Physicians Group - University of South Florida System
USF Physicians Group - University of South Florida System

Create successful ePaper yourself
Turn your PDF publications into a flip-book with our unique Google optimized e-Paper software.
<strong>USF</strong> <strong>Physicians</strong><strong>Group</strong>Picture here with meand studentAugust 6, 2001IDX National Users ConferenceJoseph M. Jackson, MBAExecutive DirectorUsfpg/exec/2006/jackson/bot hsc mtg april 2006
Faculty Practice PlanDepartment <strong>of</strong> AdministrationOffice <strong>of</strong> the Vice Presidentfor Health SciencesBryan S. BurgessAssociate VP for Corporate andTransactional AffairsExecutive AdvisorMary HughesAcademic ProgramContractingJoseph M. Jackson, MBAExecutive DirectorEngagement ManagerPCISBetsy WillardSenior AdministrativeAssistantDiane HavelExecutive SecretaryElaine PhelpsAdministrative SecretaryTBAExecutive SecretaryFinance &AccountingHumanResourcesInformationServicesManaged Care &Business DevelopmentPatient Care ServicesRevenue CycleOperationsOffice <strong>of</strong> Pr<strong>of</strong>essionalCredentialingApril 2006
<strong>USF</strong> <strong>Physicians</strong> <strong>Group</strong>Finance & Accounting Update• Director <strong>of</strong> Finance & Accounting hiredApril 10, 2006 -- Kevin Driscoll, CPA• Controller hired April 3, 2006 –Suzanne Pyzik, CPA, CIA• Accounting Manager being recruited• Internal Auditor being recruited
<strong>USF</strong> <strong>Physicians</strong> <strong>Group</strong>Fiscal Year 2004/05 Audit Update• CME revenue recognition issues beingaddressed– Independent external CPA retained– Reviewing contracts• Accounts Payable issues to be addressedin last quarter <strong>of</strong> this fiscal year• Ernst & Young asked by Audit Committeeto submit engagement letter for FY 05/06• Goal: Clean FY 2005/06 Audit
Managed Care &Business Development• Lisa Boom appointed Director <strong>of</strong> ManagedCare & Business Development – February27, 2006
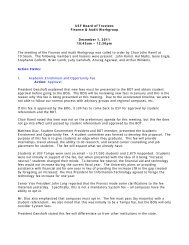
Physician Growth Rate *Total ActiveMDs Q2E<strong>USF</strong> Dept 05/06Acad Anes Model 3Cardiac CRISP 15Family Medicine 10Interdisciplinary Onc 124Internal Medicine 72Neurology 15Neurosurgery 11OB/GYN 25Ophthalmology 14Otolaryngology 7Pathology 4Pediatrics 49Psychiatry 20Radiology 18Surgery 30Grand Total 4174504003503002502001501003063903523287% 7% 11%417387400-1% 3% 4%500FYE 99/00 FYE 00/01 FYE 01/02 FYE 02/03 FYE 03/04 FYE 04/05 Q3E 05/06*Based on credentialing database for Managed Care contracting
<strong>USF</strong>PG’s Payor Mix (FY 2005)2nd Quarter FY 2005-06Managed Care 47% (down 1 pt.)*(Top 10 payors comprise 85% <strong>of</strong> all Managed Care business)Medicare 24% up 2 pts*Medicaid 9% flat*Commercial 10% up 1 pt*WorkComp 1% flat*Self Pay 8% flat*HCHCP 1% down 1 pt** As compared to 2nd Quarter FY 2004-05
Top Managed Care Payors’ CollectionsTop Managed Care Payors Based on <strong>USF</strong>PG CollectionsApril 2005 - March 2006CURRENT PREVIOUS PERCENT OF TOTALRANK RANK PAYOR COLLECTIONS MANAGED CARE COLLECTIONS DAYS IN A/R1 1 United Health Care $11,142,034 22.44% 362 2 Blue Cross Blue Shield <strong>of</strong> <strong>Florida</strong> $10,859,039 21.87% 303 3 Aetna HMO/PPO/POS $5,294,121 10.66% 254 4 CIGNA HMO/PPO $4,493,101 9.05% 255 5 Humana HMO/PPO $3,701,422 7.45% 366 6 TRICARE $2,542,994 5.12% 317 7 WellCare Inc. (StayWell, WellCare, HealthEase) $1,835,718 3.70% 458 8 Beech Street/CappCare PPO $1,341,873 2.70% 539 9 Private Healthcare <strong>System</strong>s $1,277,182 2.57% 4410 10 First Health PPO $1,218,899 2.45% 44Total Collections From Top Payors: $43,706,383 88.02%Total Managed Care Collections: $49,652,343Medicare Collections: $24,808,031Medicare Days in A/R: 28
Patient Care Services• Peggy Madill, RN, BSN, MBA appointedDirector <strong>of</strong> Patient Care Services –February 20, 2006
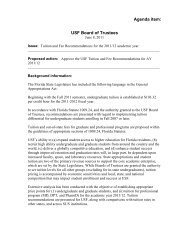
ChargesFiscal Years 1999 - 2005$350,000,000$300,000,000$250,000,000$200,000,000$166,514,958$171,691,843$187,630,592$202,866,610$218,400,320$255,863,449$289,241,779$150,000,000$100,000,000$150,677,947$50,000,000$0FY 1999 FY 2000 FY 2001 FY 2002 FY 2003 FY 2004 FY 2005 FY 2006Annualized69% increase over last 7 years
$250,000,000Charges Year To Date$200,000,000$216,931,334$199,666,504$189,423,702$150,000,000$100,000,000$50,000,000$03rd Quarter FY 2006 Actual YTD 3rd Quarter FY 2006 Budgeted YTD 3rd Quarter FY 2005 Actual
Collections$90,000,000$80,000,000$70,000,000$60,000,000$78,245,412 $77,177,431$70,903,408$50,000,000$40,000,000$30,000,000$20,000,000$10,000,000$03rd Quarter FY 2006 Actual YTD 3rd Quarter FY 2006 Budgeted YTD 3rd Quarter FY 2005 Actual
YTD Actual Gain/LossActual <strong>Group</strong> Gain is $462,640$3,000,000DIO$2,500,000$2,000,000$1,500,000INT MED$1,000,000$500,000$0-$500,000-$1,000,000RADIOLOTOLARYNNEUROSURPHYS THER FAM MEDOPHTHAL NEUROLPATHSURGPSYCHANES ACAD PEDSOB/GYNCVC-$1,500,000
Global RVUsFiscal Years 2000, 2001, 2002, 2003, 2004, 2005, and 2006 Annualized (03/31/06)3,500,0003,000,0002,500,0002,000,0001,500,0001,984,5812,077,5802,307,7142,527,5772,694,177 2,739,2222,874,2481,000,000500,0000FY 2000 FY 2001 FY 2002 FY 2003 FY 2004 FY 2005 FY 2006(Annualized)
Global RVUs Year To Date300,000278,194 272,026250,000200,000150,000100,00050,00003rd Quarter FY 2006 Actual3rd Quarter FY 2005 Actual
Collections Per Physician$255,000$245,000$244,145$235,000$225,000$215,000$216,132$216,901$205,000$208,886$195,000$185,000$198,695$196,963$190,910$175,000FY 1999 FY 2000 FY 2001 FY 2002 FY 2003 FY 2004 FY 2005
Global RVUs Per Physician710070006962690068006848670066006500640064866556648163006334620061006000FY 2000 FY 2001 FY 2002 FY 2003 FY 2004 FY 2005
North Campus Outpatient Visits140,000131,260132,519120,000100,00080,00095,175101,30797,925106,353122,432127,50760,00040,00020,0000FY 1999 FY 2000 FY 2001 FY 2002 FY 2003 FY 2004 FY 2005 AnnualizedFY 200634% increase over last 6 fiscal yearsThrough February 2006
<strong>South</strong> Campus Outpatient Visits90,00080,00070,00060,00050,00040,00030,00020,00010,000076,77368,00371,91270,63771,26471,08475,182 78,821FY 1999 FY 2000 FY 2001 FY 2002 FY 2003 FY 2004 FY 2004 AnnualizedFY 20062% decrease over last 6 fiscal yearsThrough February 2006