Metasys® for Validated Environments (MVE ... - Johnson Controls
Metasys® for Validated Environments (MVE ... - Johnson Controls
Metasys® for Validated Environments (MVE ... - Johnson Controls

You also want an ePaper? Increase the reach of your titles
YUMPU automatically turns print PDFs into web optimized ePapers that Google loves.
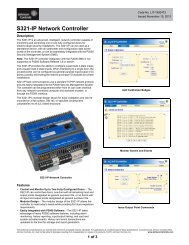
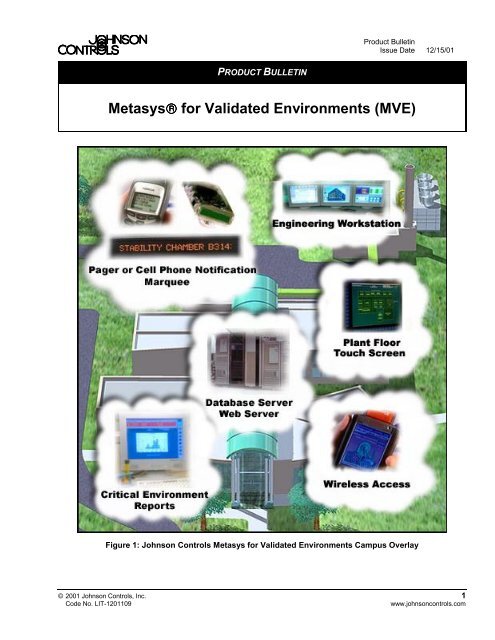
Product BulletinIssue Date 12/15/01PRODUCT BULLETIN<strong>Metasys®</strong> <strong>for</strong> <strong>Validated</strong> <strong>Environments</strong> (<strong>MVE</strong>)Figure 1: <strong>Johnson</strong> <strong>Controls</strong> Metasys <strong>for</strong> <strong>Validated</strong> <strong>Environments</strong> Campus Overlay© 2001 <strong>Johnson</strong> <strong>Controls</strong>, Inc. 1Code No. LIT-1201109www.johnsoncontrols.com
<strong>Metasys®</strong> <strong>for</strong> <strong>Validated</strong> <strong>Environments</strong> (<strong>MVE</strong>) is anenvironmental control system <strong>for</strong> facilities that may besubject to Food and Drug Administration (FDA)Title 21, Code of Federal Regulation (CFR) (morespecifically, Part 11), and electronic in<strong>for</strong>mationmanagement requirements. <strong>MVE</strong> is a specializedapplication of the <strong>Johnson</strong> <strong>Controls</strong> flagshipMetasys network that has built-in features to facilitatePart 11 compliance. The solution includes a datacenter component combined with a Web-based userinterface and the proven <strong>Johnson</strong> <strong>Controls</strong>M5 Workstation components. <strong>MVE</strong> works onWindows® 2000 Professional or Server operatingsystems.Figure 2: Metasys <strong>for</strong> <strong>Validated</strong> <strong>Environments</strong>(<strong>MVE</strong>)Features and Benefits❑ Precision DigitalEnvironmental Control❑ Scaleable Configuration❑ System Security❑ Secure Data Managementand Reporting❑ Electronic Records andSignatures❑ Time-stamped Audit Trail❑ Extensive SubsystemIntegration Library❑ Web-based Reporting❑ Intuitive Data VisualizationTools (Optional)❑ Turnkey InstallationMaintains temperature, humidity, pressureisolation, and ventilation to tight specificationsAccommodates a multitude of facility sizesbased on the number of tags and usersAssures the issues of Part 11 physical andlogical security are addressed in a way whichdeals with your corporate security policiesCollects and stores large volumes of facilitydata in a restricted access databaseCombines the efficiency of electronic recordkeeping with the security of authenticatedelectronic signaturesGenerates traceable alarm and eventtransactions in a chronological mannerIntegrates data from a variety ofenvironmental subsystems <strong>for</strong> streamlinedoperationsProvides secure access to historical recordsand reports via a standard Web browser userinterfaceImproves the efficiency and reliability of facilityoperations through predictive technology andrapid analysisGuarantees per<strong>for</strong>mance from a single pointof responsibility2 Metasys <strong>for</strong> <strong>Validated</strong> <strong>Environments</strong> (<strong>MVE</strong>) Product Bulletin
Alarm ReportsM-Alarm is used to capture alarms and events inaddition to investigating alarms and alarm frequencyof comparable systems <strong>for</strong> diagnostic purposes. Partof the standard M-Alarm Viewer Interface is seen inthe upper quadrant of Figure 6. The viewer lists allactive alarms in the system. The upper right corneris an application to quantify different alarmconditions currently in the system. Filters can beapplied to address the most urgent alarms first. Theviewer is also where the operator acknowledgesalarms and events. The lower portion of Figure 4shows the real-time trending capability, which helpsoperators to troubleshoot systems.Figure 6: M-Alarm ViewerMetasys <strong>for</strong> <strong>Validated</strong> <strong>Environments</strong> (<strong>MVE</strong>) Product Bulletin 5
Figure 7 shows the standard M-Alarm Reportinterface. From master M-Alarm Report, alarms andevents can be listed and filtered <strong>for</strong> review. Thissame logger can be used to view the audit trail ofalarms and operator transactions. It gives theoperator a window into all automatic and manualcontrol actions that have occurred in the system,collected in the secure database.All transactions contain: old and new values, date andtime of occurrence, identification of the operator, eventname, device tag name, units, and optionally an operatorannotation of the event.Figure 7: M-Alarm ReportsTime-stamped Audit TrailsThe ability to chronologically retrace alarm andevent transactions is paramount to reproducing anaudit trail during a facility system’s review by theFDA. This Part 11 requirement is met byimplementing the M-Alarm Logger of the <strong>MVE</strong>. Inaddition to logging alarms and the operator’sresponse to those alarms, it also logs events as theyoccur on the network.The secure system database contains all of thesealarms and events. The entries log both the time anddate of the individual operator transaction (<strong>for</strong> example,Login, Logout, Alarm Acknowledge, and Value Adjust orOverride) and also log the identity of that operator,providing an audit trail of the operation of the system.6 Metasys <strong>for</strong> <strong>Validated</strong> <strong>Environments</strong> (<strong>MVE</strong>) Product Bulletin
Figure 8 shows a summary of alarms and events ina bar graph <strong>for</strong>mat. A bar graphn allows quick,focused analysis of the origin of problem areas bygraphically organizing the individual alarm sourcesin order of frequency. This in<strong>for</strong>mation is alsoavailable in a pie chart.Figure 8: M-Alarm Summary Bar GraphMetasys <strong>for</strong> <strong>Validated</strong> <strong>Environments</strong> (<strong>MVE</strong>) Product Bulletin 7
Figure 9 is an example of event-driven trending. Apoint is sampled once every half hour while it is inthe normal state. When the point enters anon-normal state, the sample is recorded (to thesecond) and a more rapid sampling rate begins. Thisis called fast scan and allows <strong>for</strong> high resolutioncollection during periods of interest while keepingthe total data size manageable. These subsequentfast scan samples are also recorded to the second.Figure 9: M-Trend Graphically Displaying Data from the FX VE Secure DatabaseIn addition to Graphical displays, tabular views of thesame reports are available through M-Trend, whichcan view up to 6 attributes in the graphical view and32 attributes in the tabular view.8 Metasys <strong>for</strong> <strong>Validated</strong> <strong>Environments</strong> (<strong>MVE</strong>) Product Bulletin
Traceable Electronic RecordsElectronic records are more efficient and easier tokeep than manual records, but most electronicrecords can be easily altered. There<strong>for</strong>e, the FDArequires all electronic means of record keepingincorporate traceable electronic signatures and beavailable only to authorized users. The use ofAdobe® Acrobat® software and the <strong>MVE</strong> systemauthenticates electronic signatures to validatedocument review. Microsoft SQL C2 Security tracesdatabase alterations. These features preserve theintegrity of the data and simplify Part 11 validation.Figure 10 shows an example of a Mean KineticTemperature report <strong>for</strong> a typical product storage cabinet.In this case, readings are collected from three differentareas of the cabinet in addition to a single humiditysample. Each location provides a minimum, maximumand average reading. The Mean Kinetic Temperature isalso indicated <strong>for</strong> the selected sample period. Once theresearcher reviews the report <strong>for</strong> accuracy, she appliesher electronic signature that is then affixed to the report.Anyone who receives the report electronically can clickon the signature <strong>for</strong> verification of authenticity. Anyonewho attempts to modify this report once signed nullifiesthe signature, and the report identifies the document wasaltered after signing.Extensive Subsystem Integration LibraryThrough the Metasys Compatibility Program,<strong>Johnson</strong> <strong>Controls</strong> has developed the world’s largestlibrary of software drivers to integrate third-partydevices and subsystems. From air handlers andchillers to Programmable Logic Controllers (PLCs),particle counters and other vendor BuildingAutomation Systems (BASs), integrated devicesseamlessly become part of the <strong>MVE</strong> system and aregranted the same data security and electronictraceability features <strong>for</strong> Part 11 as native Metasyscomponents.Figure 10: Status Report with Electronic SignatureMetasys <strong>for</strong> <strong>Validated</strong> <strong>Environments</strong> (<strong>MVE</strong>) Product Bulletin 9
Standard ReportsStandard reports, summarizing historical data, areaccessible via a common Web browser.Authenticated users can use any connectedPersonal Computer (PC) to access a variety ofpredeveloped report <strong>for</strong>mats or to generate customreports created around specific applications as seenin Figure 11.Figure 11: Data Graph Sample Report10 Metasys <strong>for</strong> <strong>Validated</strong> <strong>Environments</strong> (<strong>MVE</strong>) Product Bulletin
Data VisualizationData Visualization is an optional tool applied tohistorical data help determine cause and effect andassist in a root cause analysis. Similar tools usereal-time facility data to estimate the instantaneoushealth and per<strong>for</strong>mance of all critical systems. Thereal power of data visualization comes frompredicting future events, problems, and conditions.By focusing building operators on areas of potentialconcern and allowing them to ignore common datanoise, the reliability and overall per<strong>for</strong>mance of thefacility are enhanced.Figure 12 is an example of data visualization. In thisexample, color spectrum monitors CO 2 levels in a criticalspace. Each color band from top to bottom represents aday and the colors are linked to the CO 2 level at thattime. Yellow is the warning condition while bluerepresents a zero reading. In Figure 12, CO 2 levels gointo the warning level each weekday from approximately9:00 A.M. to 1:00 P.M.Figure 12: Color Spectrum ExampleMetasys <strong>for</strong> <strong>Validated</strong> <strong>Environments</strong> (<strong>MVE</strong>) Product Bulletin 11
Figure 13 is an example of the optional StarfieldDisplay. The Starfield Display relates several piecesof dynamic Heating, Ventilating, and Air Conditioning(HVAC) data into a single visual pattern. The patternprovides an overview of the operation of manypieces of HVAC equipment. Operators can quicklyand easily see which equipment needs the mosturgent attention. A Starfield Display is like a scatterplot, which distinguishes normal or abnormalpatterns. The following star attributes can beabstracted to real data: size, brightness or color,position relative to other stars, and movement overtime. Linking star attributes to system attributes likealarm condition, run status, temperature, humidity, orpressure, equipment characteristics can berepresented by star clusters. Figure 13 representssix systems, which could be air handling units orproduction rooms.The Starfield in the lower left indicates:• the equipment is on, noted by the size of the centerstar• the command status and the equipment statusmatch because the center start is green• this Starfield monitors seven variables depicted bythe seven smaller dots surrounding the axis. Thevariables may be room temperatures or air handlercontrol variables. Four of those variables are in anormal or non-alarm state, because they are shownin green and near the center or target while threevariables are in an alarm condition, shown in blue.At a glance, the operator can identify the variable inalarm. By hovering the cursor over this point, theoperator can view the variable specifics and determinethe appropriate response.Figure 13: Starfield Display12 Metasys <strong>for</strong> <strong>Validated</strong> <strong>Environments</strong> (<strong>MVE</strong>) Product Bulletin
Turnkey InstallationEach facility is unique and has distinct operationalrequirements. <strong>Johnson</strong> <strong>Controls</strong>, with over300 offices around the world, is committed tocreating and maintaining high per<strong>for</strong>manceenvironments to support our customers’ businesses.Because building systems’ technology is usuallydelivered from a variety of subsystems andsuppliers, a single point of accountability <strong>for</strong> the finalresults is needed. That is why <strong>Johnson</strong> <strong>Controls</strong>assumes full systems integration responsibility andturnkey installation, including a complete suite ofvalidation services, if desired.Additional In<strong>for</strong>mationPlease refer to the following documents: Facility Explorer<strong>for</strong> <strong>Validated</strong> <strong>Environments</strong> Product Bulletin(LIT-120142), M5 Secure Architecture EngineeringStation or Operator Station Product Bulletin(LIT-1201110), and <strong>Johnson</strong> <strong>Controls</strong> <strong>Validated</strong><strong>Environments</strong> Product Bulletin (LIT-1201111).<strong>Controls</strong> Group507 E. Michigan StreetP.O. Box 423Milwaukee, WI 53201Printed in U.S.A.www.johnsoncontrols.comMetasys <strong>for</strong> <strong>Validated</strong> <strong>Environments</strong> (<strong>MVE</strong>) Product Bulletin 13