5-3 Human Population Growth - Downtown Magnets High School
5-3 Human Population Growth - Downtown Magnets High School
5-3 Human Population Growth - Downtown Magnets High School
You also want an ePaper? Increase the reach of your titles
YUMPU automatically turns print PDFs into web optimized ePapers that Google loves.
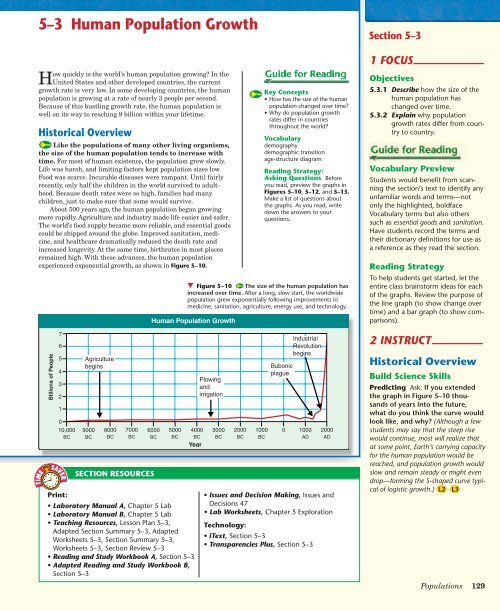
5–3 (continued)Patterns of<strong>Population</strong> <strong>Growth</strong>Use Community ResourcesEncourage small groups of studentsto research the demographics of theirown city or town over a certain periodof time. Statistics on births,deaths, total population, and otherdemographic data may be availablefrom town/city hall, a library, countyor state officials, or even real estateagencies. Suggest that the groupsmake graphs to share their findings.Use VisualsFigure 5–11 Make sure studentsunderstand what the photographsrepresent by asking them to identifythe “positive change” shown andexplain how the change has affectedpopulation growth. For example, thephotograph showing a healthcareworker giving an injection of vaccineto an infant represents medicaladvances that have significantlyreduced death rates. However, modernizationmust begin, as it has inmany nations, before birthrates startto fall.Figure 5–11 Medicaladvances can lead to adramatic drop in apopulation’s death rate.Dr. Leila Denmark (nearright), who practicedmedicine for 73 years,helped to invent thewhooping cough vaccinein 1936. A healthcareworker in Rwanda (far right)vaccinates an infant, therebyhelping to prevent certain diseasesin that child. Applying ConceptsWhich other advances can reduce apopulation’s death rate?The Demographic TransitionBirth/death ratesStage I Stage II Stage IIIBirthrateTime (years)Death rate Figure 5–12 Birthrates,death rates, and the age structureof a population help predict therate of population growth.Birthrates and death rates fall duringthe demographic transition. In Stage I,both the birthrate and death rate arehigh. During Stage II, the death ratedrops while the birthrate remainshigh. Finally, in Stage III, the birthratealso decreases.Patterns of <strong>Population</strong> <strong>Growth</strong>The human population cannot keep growing exponentially forever,because Earth and its resources are limited. The question is, whenand how will our population growth slow? Two centuries ago,English economist Thomas Malthus observed that human populationswere growing rapidly. Malthus predicted that such growthwould not continue indefinitely. Instead, according to Malthus, war,famine, and disease would limit human population growth.Today, scientists have identified a variety of other socialand economic factors that can affect human populations. Thescientific study of human populations is called demography(duh-MAH-gruh-fee). Demography examines the characteristicsof human populations and attempts to explain how thosepopulations will change over time. Birthrates, deathrates, and the age structure of a population help predictwhy some countries have high growth rates while othercountries grow more slowly.The Demographic Transition Over the past century,population growth in the United States, Japan, and much ofEurope has slowed dramatically. Demographers have developeda hypothesis to explain this shift. According to this hypothesis,these countries have completed the demographic transition,a dramatic change in birth and death rates.Throughout most of history, human societies have had highdeath rates and equally high birthrates. With advances innutrition, sanitation, and medicine, more children survive toadulthood and more adults live to old age. These changes lowerthe death rate and begin the demographic transition.Figure 5–12 shows that when the death rate first begins tofall, birthrates remain high. During this phase of the demographictransition, births greatly exceed deaths, and populationincreases rapidly. This was the situation in the United Statesfrom 1790 to 1910. Many parts of South America, Africa, andAsia are still in this phase.As societies modernize, increase their level of education, andraise their standard of living, families have fewer children. Asthe birthrate falls, population growth slows. The demographictransition is complete when the birthrate falls to meet the deathrate, and population growth stops.SUPPORT FOR ENGLISH LANGUAGE LEARNERSVocabulary: Word AnalysisBeginning On the board, show the worddemography broken into its component parts:demo-, meaning people, and graphy, meaningwritten or recorded. Then, write the completeword followed by the definition given in thetext. Read aloud what you have written tomodel correct pronunciation. Have the studentswrite the word and definition in theirnotebooks or science glossaries. Add the worddemography to a word wall with other Vocabularyterms from the chapter.Intermediate Extend the Beginning activity bywriting the word democracy on the board.Pronounce the word, and use it in a sentencethat defines the word. Point out the use of theprefix demo-, meaning people. Have the studentsinfer the meaning of the word part cracy(government).130 Chapter 5
So far, the demographic transition has been completed inonly a few countries. Despite the trend in the United States,Europe, and Japan, the worldwide human population is stillgrowing exponentially. Most people live in countries that havenot yet completed the demographic transition. Much of thepopulation growth today is contributed by only 10 countries, withIndia and China in the lead, where birthrates remain high.Age Structure <strong>Population</strong> growth depends, in part, on howmany people of different ages make up a given population.Demographers can predict future growth using models calledage-structure diagrams, or population profiles. Age-structurediagrams show the population of a country broken down by genderand age group. Each bar in the age-structure diagram representsindividuals within a 5-year group. Percentages of males are to theleft of the center line and females to the right in each group.Consider Figure 5–13, which compares the age structure of theU.S. population with that of Rwanda, a country in east-centralAfrica. In the United States, there are nearly equal numbers ofpeople in each age group. This age structure predicts a slow butsteady growth rate for the near future. In Rwanda, on the otherhand, there are many more young children than teenagers, andmany more teenagers than adults. This age structure predicts apopulation that will double in about 30 years.Age (years)80+75–7970–7465–6960–6455–5950–5445–4940–4435–3930–3425–2920–2415–1910–145–90–4What are age-structure diagrams?U.S. POPULATION8 7 6 5 4 3 2 1 0 1 2 3 4 5 6 7 8Percentage of <strong>Population</strong>Age-Structure DiagramsRWANDAN POPULATIONMales Females Males FemalesFACTS AND FIGURESControlling human populationTwo examples illustrate the complexities of controllinghuman population growth in developingnations. In India, government-sponsoredpopulation-control programs have not done well,due largely to family resistance. In desperation, thegovernment enacted a law subjecting some mento compulsory sterilization. Public outrage was sogreat that the law was rescinded. India’s populationcontinues to grow.NSTAFor: Links onpopulation growthVisit: www.SciLinks.orgWeb Code: cbn-2053 Figure 5–13 These graphsshow the age structure of the U.S.population and the Rwandanpopulation. Analyzing Data Howdo the United States and Rwanda differin the percentages of 10- to 14-yearoldsin the population?8 7 6 5 4 3 2 1 0 1 2 3 4 5 6 7 8Percentage of <strong>Population</strong>80+75–7970–7465–6960–6455–5950–5445–4940–4435–3930–3425–2920–2415–1910–145–90–4Age (years)China has instituted the most extensivefamily-planning program in the world. Coupleswho pledge to have only one child are given benefits,including better housing and salary bonuses.Couples who break this pledge lose the benefits.There have also been credible reports of womenbeing forced to undergo abortions. These policieshave curtailed explosive growth. <strong>Growth</strong> remainsrapid, though, primarily because of the manywomen entering their reproductive years.NSTADownload a worksheeton population growth for studentsto complete, and find additionalteacher support from NSTA SciLinks.Build Science SkillsInterpreting Graphics Focus students’attention on the right-handgraph in Figure 5–13 and ask: Whatoverall pattern do you see in thestructure of Rwanda’s population?(Moving from old to young, every fiveyeargroup is larger than the oldergroup above.) Why would this patternpredict a large populationincrease in the future? (Each fiveyeargroup of younger Rwandans has agreater number of females than thegroup just above. As a result, there willbe more and more women bearing childrenin the future than there aretoday.) If you compare the tophalves of the two graphs, what canyou tell about Rwanda’s population?(Death rates of older people arehigher in Rwanda than in the UnitedStates. People in Rwanda do not live aslong as people in the United States. Inthe United States, women tend to livelonger than men; in Rwanda, men tendto live longer than women.)Answers to . . .Models that graph thenumbers of people in different agegroups in a populationFigure 5–11 A population’s deathrate can be reduced by improved prenatalcare, improved sanitation, andan increase in education.Figure 5–13 In the United States,10- to 14-year-olds make up about6.5 percent of the population, and inRwanda they make up about 14 percentof the population. The difference isabout 7.5 percent—about 3.5 percentagepoints for males and 4 percentagepoints for females.<strong>Population</strong>s 131
5–3 (continued)Future <strong>Population</strong><strong>Growth</strong>Build Science SkillsMaking Judgments Ask: Whattwo opposing points of view aboutfuture population growth areexpressed in the last paragraph?(One view is stated in the sentencethat begins “Most ecologists suggest. . .” The other view is stated in the lastsentence.) Let students meet to brainstormideas about both viewpoints.Have two teams debate the viewpointsfor the class.3 ASSESSEvaluate UnderstandingHave students write a paragraph onwhy the human population grewvery slowly for many thousands ofyears and why the growth increaseddramatically about 500 years ago.ReteachIf students need help with assessmentquestions, have them rereadthe related text material and work insmall groups to quiz one another andoffer corrections.World <strong>Population</strong>: 1950–2050Year Average Annual<strong>Growth</strong> Rate (%)<strong>Population</strong>195019601962*1963*1970198019902000201020202030204020501.471.332.192.192.071.691.581.231.060.870.680.540.432,555,360,9723,039,669,3303,136,556,0923,206,072,2863,708,067,1054,454,607,3325,275,407,7896,078,684,3296,812,009,3387,515,218,8988,127,277,5068,646,671,0239,078,850,714*<strong>High</strong>est growth rate during 100-year period Figure 5–14 This table, based on actual andprojected data from the U.S. Census Bureau,International Database, shows data on worldpopulation. Predicting Based on the projectedtrend between 2040 and 2050, what might theworld population be in 2060?Future <strong>Population</strong> <strong>Growth</strong>To predict how the world’s human population willgrow, demographers must consider many factors,including the age structure of each country andthe prevalence of life-threatening diseases, suchas AIDS, malaria, and cholera. The table inFigure 5–14 shows statistics for world populationgrowth from 1950 to 2000 with projected figuresthrough the year 2050. Current projectionssuggest that by 2050, the world population mayreach more than 9 billion people.Will the human population grow at its currentrate, or will it level out to a logistic growthcurve and become stable? By 2050 the growthrate may level off or even decrease. This mayhappen if countries that are currently growingrapidly move toward the demographic transition.The figures in the table show that the growthrate in 2050 is projected to be 0.43 percent. Thisrate is a decrease from the peak growth rate of2.19 percent, reached in the early 1960s.A lower growth rate means that the humanpopulation will be growing more slowly over thenext 50 years. But, because the growth rate isstill larger than zero, our population will continueto grow. Most ecologists suggest that if thisgrowth does not slow down even more, therecould be serious damage to the environment aswell as to the global economy. On the other hand,many economists assert that science, technology,and changes in society will control those negativeimpacts on the environment and economy.A typical response will note thatthe projected world population in2050 will be over three times whatit was in 1950. Students mightwrite that the average annualgrowth rate was 1.47 percent in1950 but is projected to be only0.43 percent in 2050. Thus,though the world population willcontinue to grow through 2050,the rate of growth will diminish.5–3 Section Assessment1. Key Concept Describe thegeneral trend of human populationgrowth that has occurredover time.2. Key Concept Whatfactors explain why populationsin different countries grow atdifferent rates?3. What is demography?4. Describe the demographictransition and explain how itmight affect a country’s populationgrowth rate.5. Critical Thinking EvaluatingWhy do you think age-structurediagrams can help predict futurepopulation trends?Explanatory WritingWrite a paragraph on thetrends in the growth of worldpopulation from 1950 to2050. Be sure to distinguishbetween population growthand population growth rate.Hint: Refer to Figure 5–14 tohelp with your explanation.If your class subscribes to the iText,use it to review the Key Concepts inSection 5–3.Answer to . . .Figure 5–14 Answers may vary. Ifthe growth rate between 2040 and2050 stays the same, the world populationwill be about 9.5 billion in 2060.If the growth rate falls—the trendshown on the table—the world populationwill be less than 9.5 billion.132 Chapter 55–3 Section Assessment1. For tens of thousands of years, the humanpopulation grew very slowly. Then, about 500years ago, the population started to growexponentially and increased dramatically.2. Birthrates, death rates, and the age structureof a population3. The scientific study of human populations4. When the demographic transition begins, thebirthrate and the death rate are high. Then,the death rate drops while the birthrateremains high. Finally, the birthrate also drops.After the demographic transition, a population’sgrowth rate would be very low, andgrowth could even stop.5. Age-structure diagrams include data onyounger individuals in age groups that willcontribute to population growth as membersof those groups mature.


