2010 Annual School Report - Knox Grammar School
2010 Annual School Report - Knox Grammar School
2010 Annual School Report - Knox Grammar School

You also want an ePaper? Increase the reach of your titles
YUMPU automatically turns print PDFs into web optimized ePapers that Google loves.
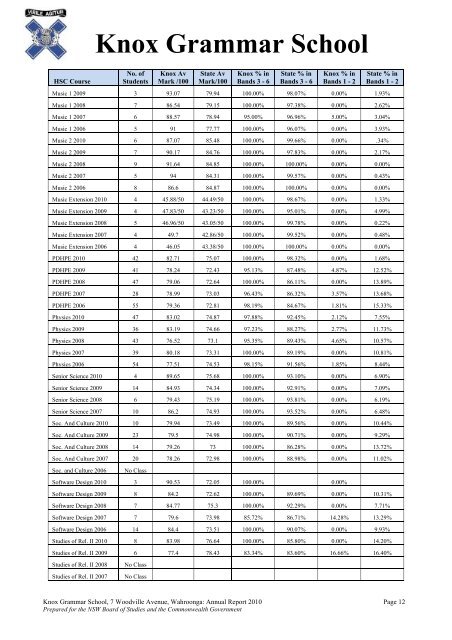
HSC Course<strong>Knox</strong> <strong>Grammar</strong> <strong>School</strong>No. ofStudents<strong>Knox</strong> AvMark /100State AvMark/100<strong>Knox</strong> % inBands 3 - 6State % inBands 3 - 6<strong>Knox</strong> % inBands 1 - 2State % inBands 1 - 2Music 1 2009 3 93.07 79.94 100.00% 98.07% 0.00% 1.93%Music 1 2008 7 86.54 79.15 100.00% 97.38% 0.00% 2.62%Music 1 2007 6 88.57 78.94 95.00% 96.96% 5.00% 3.04%Music 1 2006 5 91 77.77 100.00% 96.07% 0.00% 3.93%Music 2 <strong>2010</strong> 6 87.07 85.48 100.00% 99.66% 0.00% .34%Music 2 2009 7 90.17 84.76 100.00% 97.83% 0.00% 2.17%Music 2 2008 9 91.64 84.85 100.00% 100.00% 0.00% 0.00%Music 2 2007 5 94 84.31 100.00% 99.57% 0.00% 0.43%Music 2 2006 8 86.6 84.87 100.00% 100.00% 0.00% 0.00%Music Extension <strong>2010</strong> 4 45.88/50 44.49/50 100.00% 98.67% 0.00% 1.33%Music Extension 2009 4 47.83/50 43.23/50 100.00% 95.01% 0.00% 4.99%Music Extension 2008 5 46.96/50 43.05/50 100.00% 99.78% 0.00% 0.22%Music Extension 2007 4 49.7 42.86/50 100.00% 99.52% 0.00% 0.48%Music Extension 2006 4 46.05 43.38/50 100.00% 100.00% 0.00% 0.00%PDHPE <strong>2010</strong> 42 82.71 75.07 100.00% 98.32% 0.00% 1.68%PDHPE 2009 41 78.24 72.43 95.13% 87.48% 4.87% 12.52%PDHPE 2008 47 79.06 72.64 100.00% 86.11% 0.00% 13.89%PDHPE 2007 28 78.99 73.03 96.43% 86.32% 3.57% 13.68%PDHPE 2006 55 79.36 72.81 98.19% 84.67% 1.81% 15.33%Physics <strong>2010</strong> 47 83.02 74.87 97.88% 92.45% 2.12% 7.55%Physics 2009 36 83.19 74.66 97.23% 88.27% 2.77% 11.73%Physics 2008 43 76.52 73.1 95.35% 89.43% 4.65% 10.57%Physics 2007 39 80.18 73.31 100.00% 89.19% 0.00% 10.81%Physics 2006 54 77.51 74.53 98.15% 91.56% 1.85% 8.44%Senior Science <strong>2010</strong> 4 89.65 75.68 100.00% 93.10% 0.00% 6.90%Senior Science 2009 14 84.93 74.34 100.00% 92.91% 0.00% 7.09%Senior Science 2008 6 79.43 75.19 100.00% 93.81% 0.00% 6.19%Senior Science 2007 10 86.2 74.93 100.00% 93.52% 0.00% 6.48%Soc. And Culture <strong>2010</strong> 10 79.94 73.49 100.00% 89.56% 0.00% 10.44%Soc. And Culture 2009 23 79.5 74.98 100.00% 90.71% 0.00% 9.29%Soc. And Culture 2008 14 79.26 73 100.00% 86.28% 0.00% 13.72%Soc. And Culture 2007 20 78.26 72.98 100.00% 88.98% 0.00% 11.02%Soc. and Culture 2006No ClassSoftware Design <strong>2010</strong> 3 90.53 72.05 100.00% 0.00%Software Design 2009 8 84.2 72.62 100.00% 89.69% 0.00% 10.31%Software Design 2008 7 84.77 75.3 100.00% 92.29% 0.00% 7.71%Software Design 2007 7 79.6 73.98 85.72% 86.71% 14.28% 13.29%Software Design 2006 14 84.4 73.51 100.00% 90.07% 0.00% 9.93%Studies of Rel. II <strong>2010</strong> 8 83.98 76.64 100.00% 85.80% 0.00% 14.20%Studies of Rel. II 2009 6 77.4 78.43 83.34% 83.60% 16.66% 16.40%Studies of Rel. II 2008Studies of Rel. II 2007No ClassNo Class<strong>Knox</strong> <strong>Grammar</strong> <strong>School</strong>, 7 Woodville Avenue, Wahroonga: <strong>Annual</strong> <strong>Report</strong> <strong>2010</strong> Page 12Prepared for the NSW Board of Studies and the Commonwealth Government