2010 Annual School Report - Knox Grammar School
2010 Annual School Report - Knox Grammar School
2010 Annual School Report - Knox Grammar School

You also want an ePaper? Increase the reach of your titles
YUMPU automatically turns print PDFs into web optimized ePapers that Google loves.
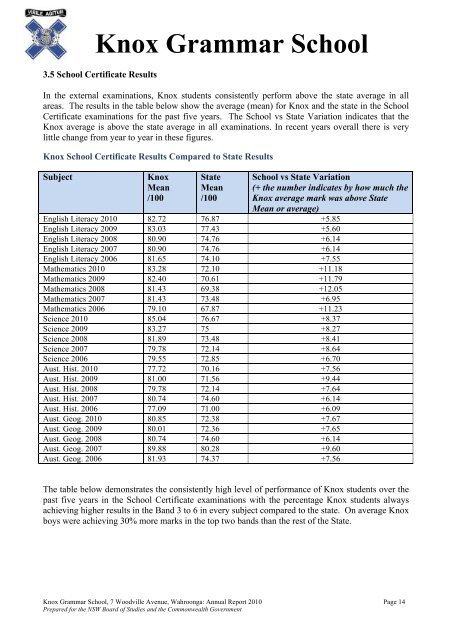
<strong>Knox</strong> <strong>Grammar</strong> <strong>School</strong>3.5 <strong>School</strong> Certificate ResultsIn the external examinations, <strong>Knox</strong> students consistently perform above the state average in allareas. The results in the table below show the average (mean) for <strong>Knox</strong> and the state in the <strong>School</strong>Certificate examinations for the past five years. The <strong>School</strong> vs State Variation indicates that the<strong>Knox</strong> average is above the state average in all examinations. In recent years overall there is verylittle change from year to year in these figures.<strong>Knox</strong> <strong>School</strong> Certificate Results Compared to State ResultsSubject<strong>Knox</strong>Mean/100StateMean/100<strong>School</strong> vs State Variation(+ the number indicates by how much the<strong>Knox</strong> average mark was above StateMean or average)English Literacy <strong>2010</strong> 82.72 76.87 +5.85English Literacy 2009 83.03 77.43 +5.60English Literacy 2008 80.90 74.76 +6.14English Literacy 2007 80.90 74.76 +6.14English Literacy 2006 81.65 74.10 +7.55Mathematics <strong>2010</strong> 83.28 72.10 +11.18Mathematics 2009 82.40 70.61 +11.79Mathematics 2008 81.43 69.38 +12.05Mathematics 2007 81.43 73.48 +6.95Mathematics 2006 79.10 67.87 +11.23Science <strong>2010</strong> 85.04 76.67 +8.37Science 2009 83.27 75 +8.27Science 2008 81.89 73.48 +8.41Science 2007 79.78 72.14 +8.64Science 2006 79.55 72.85 +6.70Aust. Hist. <strong>2010</strong> 77.72 70.16 +7.56Aust. Hist. 2009 81.00 71.56 +9.44Aust. Hist. 2008 79.78 72.14 +7.64Aust. Hist. 2007 80.74 74.60 +6.14Aust. Hist. 2006 77.09 71.00 +6.09Aust. Geog. <strong>2010</strong> 80.85 72.38 +7.67Aust. Geog. 2009 80.01 72.36 +7.65Aust. Geog. 2008 80.74 74.60 +6.14Aust. Geog. 2007 89.88 80.28 +9.60Aust. Geog. 2006 81.93 74.37 +7.56The table below demonstrates the consistently high level of performance of <strong>Knox</strong> students over thepast five years in the <strong>School</strong> Certificate examinations with the percentage <strong>Knox</strong> students alwaysachieving higher results in the Band 3 to 6 in every subject compared to the state. On average <strong>Knox</strong>boys were achieving 30% more marks in the top two bands than the rest of the State.<strong>Knox</strong> <strong>Grammar</strong> <strong>School</strong>, 7 Woodville Avenue, Wahroonga: <strong>Annual</strong> <strong>Report</strong> <strong>2010</strong> Page 14Prepared for the NSW Board of Studies and the Commonwealth Government