consolidated financial statements - Lotus Bakeries
consolidated financial statements - Lotus Bakeries
consolidated financial statements - Lotus Bakeries

Create successful ePaper yourself
Turn your PDF publications into a flip-book with our unique Google optimized e-Paper software.
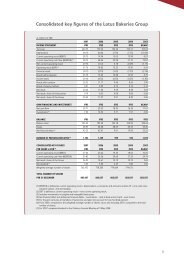
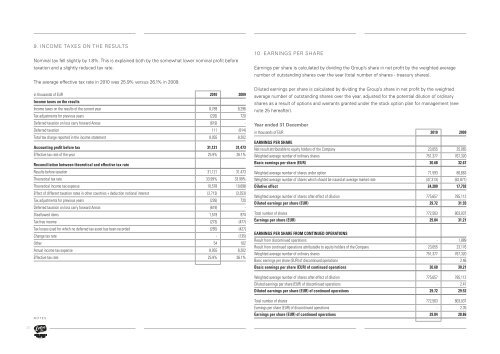
9. INCOme TAxES ON THE RESULTSNominal tax fell slightly by 1.8%. This is explained both by the somewhat lower nominal profit beforetaxation and a slightly reduced tax rate.The average effective tax rate in 2010 was 25.9% versus 26.1% in 2009.in thousands of EUR 2010 2009Income taxes on the resultsIncome taxes on the results of the current year 8,789 8,296Tax adjustments for previous years (226) 720Deferred taxation on loss carry forward Annas (619) -Deferred taxation 111 (814)Total tax charge reported in the income statement 8,055 8,202Accounting profit before tax 31,121 31,473Effective tax rate of the year 25.9% 26.1%Reconciliation between theoretical and effective tax rateResults before taxation 31,121 31,473Theoretical tax rate 33.99% 33.99%Theoretical income tax expense 10,578 10,698Effect of different taxation rates in other countries + deduction notional interest (2,713) (3,253)Tax adjustments for previous years (226) 720Deferred taxation on loss carry forward Annas (619) -Disallowed items 1,519 974Tax free income (273) (477)Tax losses used for which no deferred tax asset has been recorded (265) (427)Change tax rate - (135)Other 54 102Actual income tax expense 8,055 8,202Effective tax rate 25.9% 26.1%10. EARNINGS PER SHAREEarnings per share is calculated by dividing the Group’s share in net profit by the weighted averagenumber of outstanding shares over the year (total number of shares - treasury shares).Diluted earnings per share is calculated by dividing the Group’s share in net profit by the weightedaverage number of outstanding shares over the year, adjusted for the potential dilution of ordinaryshares as a result of options and warrants granted under the stock option plan for management (seenote 25 hereafter).Year ended 31 Decemberin thousands of EUR 2010 2009EARNINGS pER shARENet result attributable to equity holders of the Company 23,055 25,065Weighted average number of ordinary shares 751,377 767,320Basic earnings per share (EUR) 30.68 32.67Weighted average number of shares under option 71,593 80,663Weighted average number of shares which should be issued at average market rate (47,313) (62,871)Dilutive effect 24,280 17,792Weighted average number of shares after effect of dilution 775,657 785,112Diluted earnings per share (EUR) 29.72 31.93Total number of shares 772,563 803,037Earnings per share (EUR) 29.84 31.21EARNINGS pER shARE FROm CONTINUED opERATIONSResult from discontinued operations - 1,889Result from continued operations attributable to equity holders of the Company 23,055 23,176Weighted average number of ordinary shares 751,377 767,320Basic earnings per share (EUR) of discontinued operations - 2.46Basic earnings per share (EUR) of continued operations 30.68 30.21Weighted average number of shares after effect of dilution 775,657 785,112Diluted earnings per share (EUR) of discontinued operations - 2.41Diluted earnings per share (EUR) of continued operations 29.72 29.52n o t e sTotal number of shares 772,563 803,037Earnings per share (EUR) of discontinued operations - 2.35Earnings per share (EUR) of continued operations 29.84 28.8620