Powerpoint: Paleoclimatology And climate change Summer School ...
Powerpoint: Paleoclimatology And climate change Summer School ...
Powerpoint: Paleoclimatology And climate change Summer School ...

You also want an ePaper? Increase the reach of your titles
YUMPU automatically turns print PDFs into web optimized ePapers that Google loves.
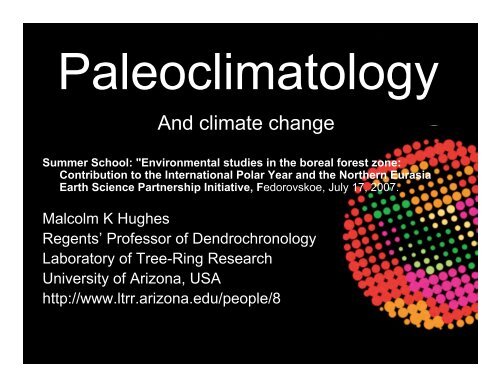
<strong>Paleoclimatology</strong><strong>And</strong> <strong>climate</strong> <strong>change</strong><strong>Summer</strong> <strong>School</strong>: "Environmental studies in the boreal forest zone:Contribution to the International Polar Year and the Northern EurasiaEarth Science Partnership Initiative, Fedorovskoe, July 17, 2007.Malcolm K HughesRegents’ Professor of DendrochronologyLaboratory of Tree-Ring ResearchUniversity of Arizona, USAhttp://www.ltrr.arizona.edu/people/8
A <strong>change</strong>d, and changing worldIGBP, 2001
A <strong>change</strong>d, and changing world• Paul Crutzen, Nobel laureate in Chemistry hassuggested that the time since the industrialrevolution be designated as a new geologicalperiod – the “Anthropocene”, so great andpervasive is the human influence on the Earth.• Formerly, the Sun, the Earth’s orbit, the tilt of itsaxis, the influence of the Biosphere andGeosphere, and geography, controlled <strong>climate</strong>variability.• Now, we “mark the Earth” – with ruin?
MassachusettsJanuary 1, -25°CClimate is aboutthe range ofSouthern Arizonapossibilities thatcan beJulyexpected1, 43°Cat a place.Climate <strong>change</strong>is about a shiftinSwissthat rangeAlpsJuly 1, 14°CFinnish LaplandSeptember 25, 11°C
Energy deficitEnergy surplusEnergy deficitIncoming solar radiationFlux (W m -2 )Outgoing thermal radiationTransportPoleEquatorPoleRedrawn from Taylor (2006)Taylor, FW (2006) Elementary Climate Physics.Oxford University Press
The Natural Greenhouse Effect• Solar radiationGreenhouse gasesLong-waveradiationEnhanced greenhouseeffectDouble* CO 2 direct effect+ 1.2°CDouble CO 2 plusfeedbacks+ 2.5°C +/-???-6°C 15°CModified from Houghton, 2004*Double the pre-industrial level, likely to be reached by 2050
Feedbacks*• Water-vapor feedback– Warmer atmosphere is wetter, water vapor is agreenhouse gas (+)• Cloud-radiation feedback– Can reflect solar radiation (-), or absorb heat (+)• Ocean-circulation feedback (+/-)– Complex, e.g. warm sea surface, more water vapor,more active atmosphere, more wind, stronger oceancirculation• Ice-albedo feedback– As ice melts, less light reflected to space, moreabsorbed and so more ice melted (+)+ or - sign of feedback to greenhouse effect* some of the toughest challengesfor <strong>climate</strong> modelers
Climate Models• These are mathematical summaries ofwhat we know about the mechanisms ofthe <strong>climate</strong> system.• One of the major tests of these modelsis to reproduce the main features ofmodern <strong>climate</strong>.• Another is to capture the dynamic<strong>change</strong>s of the recent Ice Ages, in timeand geographically.√√√ - not perfect, but very informative.
How was <strong>climate</strong> before us?Photos: MarkTwickler; NOAA<strong>Paleoclimatology</strong>Program6°CRaynaud et al, 2003; PAGES
Our time in the context of recentEarth HistoryIce ages have waxed and waned over the last800,000 years with linked <strong>change</strong>s in:•global <strong>climate</strong> (including temperature)•the volume of land ice•the living world and•sea level and the area of coastal land•the concentrations of some gases in theatmosphere (especially carbon dioxide andmethane) ,These fluctuations have limits, and they have some regularity.
Our time in the context of recentEarth History• The pacemaker of the ice ages has beendriven by regular <strong>change</strong>s in the Earth’sorbit and the tilt of its axisApproximate primary periods:Eccentricity 100,000 yearsPrecession 23,000/18,000 yearsTilt41,000 yearsHence a rich pattern of changing seasonality at different latitudes over time,which affects the growth and retreat of the great ice sheets.Diagram Courtesy of Windows to theUniverse, http://www.windows.ucar.edu
What happens if we push a forcingfactor outside its normal range?Alverson et al., 2003.
Checking the models –what actually happened?
Mainly solarand volcanicMainly GH gases+ sulfate aerosol3.6°FIPCC TAR Summary for Policymakers(2001)http://www.grida.no/<strong>climate</strong>/ipcc_tar/wg1/figspm-4.htm
Human-induced OceanWarming since 1960Observed signalDue to solar and volcanic effectsRange of “free behavior”Signal strength in °CBarnet et al. 2005
Human-induced OceanWarming since 1960Observed signalModeled range ofgreenhouse warmingeffect.Signal strength in °CThe picture is similar in all the oceans.Barnet et al. 2005
The verdict based on the last 150years?• The observed patterns cannot beexplained without a major role forincreased greenhouse gases, especiallycarbon dioxide, and for sulfate aerosols.• The increases in greenhouse gases andsulfate aerosols overwhelmingly resultfrom human activities.• Therefore human activities can <strong>change</strong> theglobal <strong>climate</strong> and already have.
What about the centuries justbefore the “Anthropocene”?
Can’t use thermometer records…..19901890Land based temperature stations in Global Historical Climate Network1840 1790Mapspreparedby Dr.FenbiaoNi
400 original records used, condensed to 112Can’t use thermometers, ..but we did use these…Trained on main patterns in annual surfacetemperature record, 1902-1980; checked on 1854-1901MannBradley,Hughes,1998
To calculate yearly maps of temperature…Maps are very testableCool-0.8 0 0.8degreesWarm
2.9°F..from which we got this…
…and this….Northern Hemisphere mean temperature since AD 1000Mann, Bradley, Hughes, 1999
<strong>And</strong> others get similar resultsindependently…From historical documents and earlymeteorological instruments….Luterbacher et al., 2004
…with completely independentdata and methods – glaciers...1928South Cascade GlacierWashington State2000Pictures courtesy of USGS
Oerlemans, 2005
..borehole temperatures…Huang, Pollack,and Shen, 2000
The picture is less firm before ~AD1600 (as we showed in ‘99).NAS 2006
IPCC AR4* took all availablereconstructions and plotted theiroverlap:* Intergovernmental Panel on Climate Change, 4 th Assessment Report, 2007
Compare this with <strong>climate</strong>model runs:WithWithout greenhouse gases
Can draw reasonable conclusions:• The common pattern of variability seen in manykinds of records, and many analyses for the lastseveral centuries shows the late 20 th / early 21 stcentury as the warmest period for severalhundred years.• Until the 20 th century the general patterns canbe accounted for by solar and volcanic forcing.• It is not possible to reasonably explain thecourse of <strong>change</strong> from the 19 th to late 20 thcentury without greenhouse gases and sulfateaerosols.
Describing AND understanding thehistory of <strong>climate</strong> shows:• There have been large, unprecedented,increases in carbon dioxide and other humanproducedgreenhouse gases (GHG) over last150 years.• Temperature has increased at a rate, in placesand at times distant and recent, consistent withmodel projections including major GHG effects.• Many other <strong>climate</strong> data also consistent.• The basic physics of the greenhouse effectsupport this.
Thanks for yourattention!

![View Powerpoint Slides [PDF]](https://img.yumpu.com/32486693/1/190x146/view-powerpoint-slides-pdf.jpg?quality=85)


![View Powerpoint Slides [PDF]](https://img.yumpu.com/29411106/1/190x143/view-powerpoint-slides-pdf.jpg?quality=85)