- Page 1 and 2:
CopyrightbyRadhika Anantharaman Nai
- Page 3 and 4:
EVALUATION OF FACTORS RELATED TO PR
- Page 5 and 6:
AcknowledgementsThis dissertation a
- Page 7 and 8:
estimate prices of the drugs. Time
- Page 9 and 10:
PageRegulatory Changes in 1997 and
- Page 11 and 12:
PageCHAPTER 4: METHODOLOGY . . . .
- Page 13 and 14:
PagePrescription Drug Expenditures
- Page 15 and 16:
PageObjective II . . . . . . . . .
- Page 17 and 18:
PageDTCA Expenditures . . . . . . .
- Page 19 and 20:
LIST OF TABLES PageTable 2.1: Regul
- Page 21 and 22:
PageTable 5.20: Mixed Model Analyse
- Page 23 and 24:
PageTable 5.37: Mixed Model Analyse
- Page 25 and 26:
PageTable 5.54: Mixed Model Analyse
- Page 27 and 28:
PageTable 6.5: Results for Hypothes
- Page 29 and 30:
PageFigure 5.4: Trends in Total DTC
- Page 31 and 32:
PageFigure 5.30: Trends in Total DT
- Page 33 and 34:
CHAPTER 1: INTRODUCTIONBACKGROUNDPr
- Page 35 and 36:
Figure 1.2: Annual Percent Change i
- Page 37 and 38:
addition, the guidelines for detect
- Page 39 and 40:
Direct-to-Consumer Advertising Expe
- Page 41 and 42:
of the guidelines, manufacturers fe
- Page 43 and 44:
percent whereas private health insu
- Page 45 and 46:
public coverage has remained about
- Page 47 and 48:
According to the National Center fo
- Page 49 and 50:
As mentioned previously, DTCA can a
- Page 51 and 52:
one drug prescribed has not increas
- Page 53 and 54:
drugs is encouraged. 66 All these f
- Page 55 and 56:
(a) To determine the relationships
- Page 57 and 58:
enefit of DTCA, many claim that DTC
- Page 59 and 60:
persistent and will shop around unt
- Page 61 and 62:
advertisements describe and discuss
- Page 63 and 64:
These advertisements were aired mai
- Page 65 and 66:
During this time, the FDA realized
- Page 67 and 68:
included media tours in which physi
- Page 69 and 70:
care for their condition, it does n
- Page 71 and 72:
It is possible that due to the infl
- Page 73 and 74:
mistakenly believe that there is a
- Page 75 and 76:
Thus, advertising could cause patie
- Page 77 and 78:
Kefauver-Harris Drug Amendments als
- Page 79 and 80:
equire the industry to provide a de
- Page 81 and 82:
(d) Provide a statement that inform
- Page 83 and 84:
choose which side effects and contr
- Page 85 and 86:
The studies that tested these effec
- Page 87 and 88:
were more likely to have seen an ad
- Page 89 and 90:
disease it treats (51.0%). One-half
- Page 91 and 92:
advertised drug and on average used
- Page 93 and 94:
about a specific brand (1999-13.0%,
- Page 95 and 96:
Table 2.2: Prevention Magazine Surv
- Page 97 and 98:
eported that the physician recommen
- Page 99 and 100:
Maddox and Katsanis in a study publ
- Page 101 and 102:
drug, but not the disease or condit
- Page 103 and 104:
and 35.0 percent were prompted to h
- Page 105 and 106:
Glasgow et al. identified factors r
- Page 107 and 108:
Time, Inc. conducted two surveys of
- Page 109 and 110:
not be disappointed in the physicia
- Page 111 and 112:
quit smoking were not aware of it.
- Page 113 and 114:
2001 study by Allison-Ottey et al.
- Page 115 and 116:
and perceived risk. Argument qualit
- Page 117 and 118:
esults were obtained from most stud
- Page 119 and 120:
In 1997, IMS Health along with Phys
- Page 121 and 122:
medication and 7.0 percent gave the
- Page 123 and 124:
Results of the studies described in
- Page 125 and 126:
The study reported that 46.0 percen
- Page 127 and 128:
setting were more likely to have a
- Page 129 and 130:
advertising to build brand loyalty
- Page 131 and 132:
advertisements, headlines and subhe
- Page 133 and 134:
offer to provide more information i
- Page 135 and 136:
was increased, recall of risk infor
- Page 137 and 138:
SummaryConsumers are increasingly a
- Page 139 and 140:
including drugs used to treat high
- Page 141 and 142:
the increased prescription drug exp
- Page 143 and 144:
Office focus cluster had high expen
- Page 145 and 146:
especially detailing. This made it
- Page 147 and 148:
to a 47.8 percent increase in presc
- Page 149 and 150:
enign prostatic hypertrophy. 311 Ev
- Page 151 and 152:
which helped assess the impact of D
- Page 153 and 154:
elationship was significant only af
- Page 155 and 156:
DTCA expenditures and market share
- Page 157 and 158:
classes accounted for 75.0 percent
- Page 159 and 160:
DTCA expenditures along with prescr
- Page 161 and 162:
eneficiaries with coverage may rece
- Page 163 and 164:
utilization of prescription drugs i
- Page 165 and 166:
who were uninsured or were enrolled
- Page 167 and 168:
Access to Care and Utilization of P
- Page 169 and 170:
Among Medicare beneficiaries, suppl
- Page 171 and 172:
coverage filled fewer prescriptions
- Page 173 and 174:
than men and are receive more presc
- Page 175 and 176:
the prescription drug accounted for
- Page 177 and 178:
vs. 17.9%) or heavy users (21.4% vs
- Page 179 and 180:
visits than men. In 1998, the avera
- Page 181 and 182:
each household was causally associa
- Page 183 and 184:
eports, employment status, and read
- Page 185 and 186:
Demographics (Age and Gender) and U
- Page 187 and 188:
drugs use was largely due to drugs
- Page 189 and 190:
The study results indicated that th
- Page 191 and 192:
though the difference in the averag
- Page 193 and 194:
According to the study based on dat
- Page 195 and 196:
Summary of the LiteratureThese stud
- Page 197 and 198:
In a model predicting prescription
- Page 199 and 200:
Summary of the LiteratureUtilizatio
- Page 201 and 202:
esults are skewed, especially when
- Page 203 and 204:
Several other factors and market dy
- Page 205 and 206:
H 1 : An increase in DTCA expenditu
- Page 207 and 208:
H 14 : There is no significant rela
- Page 209 and 210:
H 24 : An increase in the proportio
- Page 211 and 212:
GastrointestinalsObjective ITo dete
- Page 213 and 214:
H 46 : An increase in the proportio
- Page 215 and 216:
access to care will be significantl
- Page 217 and 218:
AntihypertensivesObjective ITo dete
- Page 219 and 220:
H 80 : An increase in the proportio
- Page 221 and 222:
Data Collection MethodologyThe basi
- Page 223 and 224:
As mentioned earlier, CMR also coll
- Page 225 and 226:
oadcasting industry survey conducte
- Page 227 and 228:
stated previously, data for the rem
- Page 229 and 230:
are to be recorded. A perforation b
- Page 231 and 232:
truncated, but this leads to an und
- Page 233 and 234:
As discussed in Chapter 2, with the
- Page 235 and 236:
The total monthly advertising expen
- Page 237 and 238:
64 years, 65-74 years, and 75 years
- Page 239 and 240:
Table 4.2: United States City Avera
- Page 241 and 242:
including chronic conditions (e.g.,
- Page 243 and 244:
2000. The ICD-9 CM code for irritab
- Page 245 and 246:
The ICD-9 CM codes used to identify
- Page 247 and 248:
errors, the significance of the par
- Page 249 and 250:
presence of autocorrelation, data w
- Page 251 and 252:
measured for each drug over a perio
- Page 253 and 254:
August 1997 and September 1997 to A
- Page 255 and 256:
CHAPTER 5: RESULTSChapter 5 will pr
- Page 257 and 258:
$39.8 million in 1995 accounting fo
- Page 259 and 260:
each year to $1,091.7 million in 19
- Page 261 and 262:
The number of months represent the
- Page 263 and 264:
print and billboard advertising exp
- Page 265 and 266:
1998, but then decreased every year
- Page 267 and 268: advertised allergy medications was
- Page 269 and 270: Figure 5.8: Trend in the Number of
- Page 271 and 272: Since 1997, nine out of ten individ
- Page 273 and 274: increase in prescription drug expen
- Page 275 and 276: The total DTCA expenditures for ant
- Page 277 and 278: Figure 5.14: Trend in DTCA Expendit
- Page 279 and 280: 1994 to $14.3 million in 1995, but
- Page 281 and 282: Table 5.6: Number and Percentage of
- Page 283 and 284: Figure 5.17: Trends in Percentage o
- Page 285 and 286: Prescription Drug ExpendituresThis
- Page 287 and 288: Figure 5.20: Trends in Prescription
- Page 289 and 290: Since the guidelines for broadcast
- Page 291 and 292: Gastrointestinal-Related Physician
- Page 293 and 294: visits and number of prescriptions
- Page 295 and 296: prescriptions written decreasing to
- Page 297 and 298: 64.0%), had health insurance covera
- Page 299 and 300: Figure 5.27: Trends in Total Prescr
- Page 301 and 302: AntidepressantsDTCA ExpendituresFig
- Page 303 and 304: The total DTCA expenditures increas
- Page 305 and 306: percentage of visits when the visit
- Page 307 and 308: Figure 5.32: Trends in Percentage o
- Page 309 and 310: presented in the methodology, the e
- Page 311 and 312: Figure 5.35: Trends in Prescription
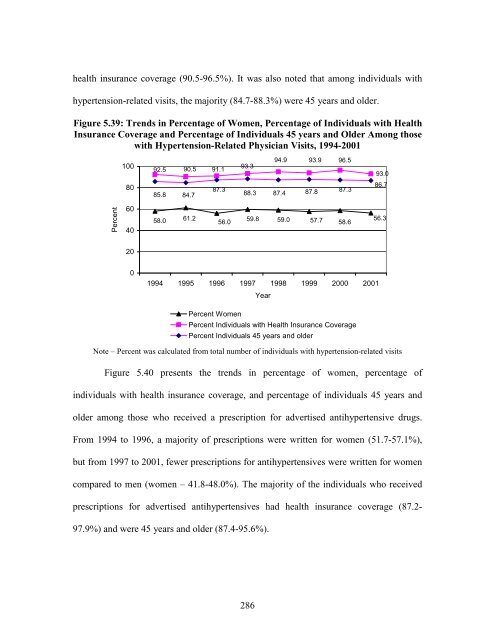
- Page 313 and 314: heavily advertised antihypertensive
- Page 315 and 316: antihypertensives and number of hyp
- Page 317: Figure 5.38: Trend in the Number of
- Page 321 and 322: study, total drug expenditures did
- Page 323 and 324: the advertised drugs from the respe
- Page 325 and 326: In the dataset for mixed model anal
- Page 327 and 328: monthly allergy-related physician v
- Page 329 and 330: Table 5.14: Test Statistics for Ord
- Page 331 and 332: of individuals 45 years and older,
- Page 333 and 334: and time period indicates that the
- Page 335 and 336: values in the dataset for the perce
- Page 337 and 338: Increase in the allergy-related vis
- Page 339 and 340: Table 5.18: Mixed Model Analysis fo
- Page 341 and 342: elated visit increase, the drug exp
- Page 343 and 344: independent variables was associate
- Page 345 and 346: The Durbin-Watson statistic for thi
- Page 347 and 348: untransformed values yielded differ
- Page 349 and 350: Mixed Model Analysis with Transform
- Page 351 and 352: Table 5.25: Untransformed Mixed Mod
- Page 353 and 354: significant in both time periods (T
- Page 355 and 356: The significant variables in this a
- Page 357 and 358: Table 5.28: Untransformed Mixed Mod
- Page 359 and 360: in the drug expenditures for advert
- Page 361 and 362: coefficient for this variable was 6
- Page 363 and 364: years, 45-64 years, and 65 years an
- Page 365 and 366: in time period one compared to time
- Page 367 and 368: Table 5.33: Untransformed Mixed Mod
- Page 369 and 370:
Table 5.34: Mixed Model Analysis fo
- Page 371 and 372:
every one percent increase in indiv
- Page 373 and 374:
less than 25 years, 25-44 years, 45
- Page 375 and 376:
significant relationships in both t
- Page 377 and 378:
visit {df=235, t=9.64, p
- Page 379 and 380:
variables in the equation. For ever
- Page 381 and 382:
for gastrointestinal-related visits
- Page 383 and 384:
Table 5.42: Untransformed Mixed Mod
- Page 385 and 386:
In the absence of the visit variabl
- Page 387 and 388:
expenditures, and drug expenditures
- Page 389 and 390:
Table 5.46: Mixed Model Analyses fo
- Page 391 and 392:
untransformed variables were reconf
- Page 393 and 394:
Table 5.48: Test Statistics for Ord
- Page 395 and 396:
while controlling for other variabl
- Page 397 and 398:
1997 to April 2001), which categori
- Page 399 and 400:
antidepressants, the analysis was r
- Page 401 and 402:
variables in the equation. The perc
- Page 403 and 404:
The only age variable that was sign
- Page 405 and 406:
prescriptions written for advertise
- Page 407 and 408:
in time period two was not supporte
- Page 409 and 410:
with health insurance coverage had
- Page 411 and 412:
with the transformed variables (Tab
- Page 413 and 414:
prescription for advertised antidep
- Page 415 and 416:
significant variables indicating th
- Page 417 and 418:
antidepressants and were 65 years a
- Page 419 and 420:
Time series analysis was employed t
- Page 421 and 422:
Table 5.63: Test Statistics for Ord
- Page 423 and 424:
The results of the mixed model anal
- Page 425 and 426:
The significant variables in the an
- Page 427 and 428:
number of prescriptions written for
- Page 429 and 430:
elated visits, DTCA expenditures fo
- Page 431 and 432:
The interaction between DTCA expend
- Page 433 and 434:
An increase in number of hypertensi
- Page 435 and 436:
in the equation. In time period two
- Page 437 and 438:
200 and 360 outlets (spot markets),
- Page 439 and 440:
to three reasons for visits were re
- Page 441 and 442:
The access or health insurance cove
- Page 443 and 444:
• A wider use of the drugs may re
- Page 445 and 446:
Table 6.1: Results of the Hypothese
- Page 447 and 448:
Tables 6.3 and 6.4 provide a snapsh
- Page 449 and 450:
market and advertising of these dru
- Page 451 and 452:
(p=0.071). On splitting the dataset
- Page 453 and 454:
antidepressants and depression-rela
- Page 455 and 456:
The results for age should be inter
- Page 457 and 458:
Objective II: Hypotheses for the De
- Page 459 and 460:
Objective IV: Hypotheses for Depend
- Page 461 and 462:
For every $1,000 increase in DTCA e
- Page 463 and 464:
prescriptions written for antidepre
- Page 465 and 466:
were positively and significantly r
- Page 467 and 468:
coverage were more likely to be pre
- Page 469 and 470:
antihypertensives reduced drastical
- Page 471 and 472:
The upheavals in the market may be
- Page 473 and 474:
a result of advertising, patients m
- Page 475 and 476:
included in the study, inducing phy
- Page 477 and 478:
new prescriptions or rather are a r
- Page 479 and 480:
Objective III: Hypotheses for the D
- Page 481 and 482:
Objective IV: Hypotheses for the De
- Page 483 and 484:
DTCA ExpendituresSimilar to the rel
- Page 485 and 486:
expenditures and prescriptions writ
- Page 487 and 488:
expenditures for antihypertensives.
- Page 489 and 490:
also possible that individuals rece
- Page 491 and 492:
eported increased expenditures by a
- Page 493 and 494:
awareness for consumers and physici
- Page 495 and 496:
as well as number of prescriptions
- Page 497 and 498:
Some studies have reported that wom
- Page 499 and 500:
Physician VisitsPhysician visits (s
- Page 501 and 502:
individuals had a positive relation
- Page 503 and 504:
not only due to DTCA, but also othe
- Page 505 and 506:
should be repeated for these newer
- Page 507 and 508:
GLOSSARY OF ACRONYMSAARP - American
- Page 509 and 510:
Average Wholesale Price of Drugs, 1
- Page 511 and 512:
Total DTCA Expenditures (in million
- Page 513 and 514:
Number and Percentage of Prescripti
- Page 515 and 516:
Number and Percentage of Prescripti
- Page 517 and 518:
Percentage of Women Among those who
- Page 519 and 520:
Appendix FTables for Percentage of
- Page 521 and 522:
Percentage of Individuals with Heal
- Page 523 and 524:
Number And Percentage Of Prescripti
- Page 525 and 526:
Number and Percentage of Prescripti
- Page 527 and 528:
DrugCapoten®ToprolXL®Altace®Numb
- Page 529 and 530:
Appendix HFigures for Percentage of
- Page 531 and 532:
Percentage of Prescriptions Written
- Page 533 and 534:
Appendix ITables for Total Prescrip
- Page 535 and 536:
Total Prescription Drug Expenditure
- Page 537 and 538:
BIBLIOGRAPHY. 21 C.F.R. § 202.1(1)
- Page 539 and 540:
Direct-to-consumer advertisement of
- Page 541 and 542:
Health care in America: Trends in u
- Page 543 and 544:
Report to the President: Prescripti
- Page 545 and 546:
Angel JE. Drug advertisements and p
- Page 547 and 548:
Cain G. A remedy for rising drug co
- Page 549 and 550:
Eng HJ, Lairson DR. Prescribed medi
- Page 551 and 552:
Goldman DP, Joyce GF, Escarce JJ, e
- Page 553 and 554:
IMS-Health. Paper presented at: Pha
- Page 555 and 556:
Lipsky MS, Taylor CA. The opinions
- Page 557 and 558:
Morris LA, Mazis MB, Brinberg D. Ri
- Page 559 and 560:
Rosenbach ML, Irvin C, Coulam RF. A
- Page 561 and 562:
Smart S, Williams C. Half of drug a
- Page 563 and 564:
Wind Y. Pharmaceutical advertising: