Image Segmentation Using Watershed and Normalized Cut - PUC-Rio
Image Segmentation Using Watershed and Normalized Cut - PUC-Rio
Image Segmentation Using Watershed and Normalized Cut - PUC-Rio

Create successful ePaper yourself
Turn your PDF publications into a flip-book with our unique Google optimized e-Paper software.
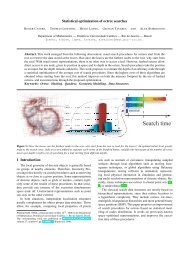
<strong>Image</strong> <strong>Segmentation</strong> <strong>Using</strong> <strong>Watershed</strong> <strong>and</strong> <strong>Normalized</strong> <strong>Cut</strong>Marco Antonio Garcia de CarvalhoTiago William PintoAnselmo Castelo Branco FerreiraSchool of TechnologyUniversity of Campinas - UNICAMPLimeira/SP, Brazil{magic,t025323,a023169}@ft.unicamp.brRoberto Marcondes César JúniorDepartment of Computer Science - IMEUniversity of São Paulo - USPSão Paulo/SP, Brazilcesar@ime.usp.brAbstract—Several publications have studied the graph spectra(a concept extracted from linear algebra) as a partitioningtool. This work studies a method called <strong>Normalized</strong> <strong>Cut</strong>,introduced by Shi <strong>and</strong> Malik [1] <strong>and</strong> proposes an imagesegmentation strategy utilizing two ways to convert imagesinto graphs: Pixel affinity <strong>and</strong> watershed transform. Both waysprovide us as result a similarity matrix that is used to calculatethe spectral graph properties (eigenvalues <strong>and</strong> eigenvectors)<strong>and</strong> then apply the grouping algorithm. <strong>Image</strong>s of yeast cellswere used to generate the preliminary results obtained <strong>and</strong>provide important knowledge for future research.Keywords-image segmentation; watershed transform; graphpartitioning; spectral graph.I. INTRODUCTIONThe relationship between some linear algebra concepts<strong>and</strong> graph theory provides an way to segment an imageinto meaningful regions <strong>and</strong> extract its semantic information.Spectral graph theory has evolved <strong>and</strong> encouraged numerousworks on digital image processing domain[2].Graph cuts may be explored to analyze the degree ofdissimilarity between parts of an graph (or its correspondingimage). In this paper, we study an approach based on graphcuts called <strong>Normalized</strong> <strong>Cut</strong> (Ncut) [1] <strong>and</strong> its associationwith concepts extracted from the study of eigenvalues <strong>and</strong>eigenvectors problems.Our experiments use two approaches in order to convertimages into graphs: The brightness formula showed in [1](Pixel Affinity) <strong>and</strong> the <strong>Watershed</strong> Transform [3],[4].II. IMAGE-GRAPH CONVERSION METHODSFirstly, we need to convert the image into a graph. Givenan image I, this work uses the following methods in orderto implement this conversion.A. Pixel affinityThe overall quality of the segmentation depends on thepairwise pixel affinity graph. The chosen properties werethe intensity <strong>and</strong> position approach presented in [1]. In thisformulation, each pixel corresponds to one node in a graph.Because the graph must be not cyclic, the affinity betweena pixel <strong>and</strong> itself is 0. Equation (1) shows the formula tocalculate the affinity matrix W I (i, j).W I (i, j) = e −‖Xi−Xj‖2 /σ x−‖C i−C j‖ 2 /σ C(1)where X i <strong>and</strong> X j are vectors containing the xy positionsof the pixels i <strong>and</strong> j; C i <strong>and</strong> C j are vectors containing theRGB values (or graylevel values) of these same pixels.B. <strong>Watershed</strong> TransformWe consider the gradient image as a topographic surface.In the watershed method, an image is segmented by constructingthe catchment basins of its gradient image. Thegradient image is flooded starting from selected sources(regional minima) until the whole image has been flooded.A dam is erected between lakes that meet with others lakes.At the end of the flooding process, we obtain one region foreach catchment basin of the gradient image.Hierarchical <strong>Watershed</strong> creates a set of nested partitions,i.e., a hierarchy. In this case, a partition at a coarse level isobtained by merging regions of the fine partition[4].The watershed problem can be modeled using graphs. Thegradient image is represented by a weighted neighborhoodgraph, where a node represents a catchment basin of thetopographic surface. We use Hierarchical <strong>Watershed</strong> in orderto reduce the number of nodes (supersegmentation problem)in the correspondent graph.After the conversion, we use the area <strong>and</strong> averagegrayscale level of each region to set the edges weightsbetween them.III. GRAPH REPRESENTATIONWe assume G = (V, E) as an undirected graph where V is theset of nodes <strong>and</strong> E is the set of edges (i, j). Two nodes i, j areadjacent, represented by i j, if there exists an edge linking i <strong>and</strong>j, <strong>and</strong> the weight associated to each edge (i, j) is represented byw(i, j). The mathematical representation for this graph is given asfollows:• Similarity matrix: A similarity matrix A is a representation foran undirected weighted graph where each entry value a(i, j)is the edge weight w(i, j) linking a pair of nodes. The weightsare given by a function that maximize the similarity betweennodes i <strong>and</strong> j.
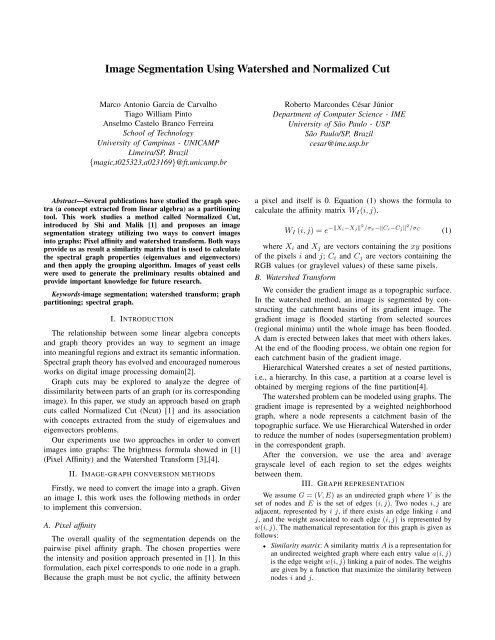
• Weighted degree matrix: Let d(i) = ∑ w(i, j) be the totalconnection from node i to all its neighbor nodes. Then theweighted degree matrix D is the diagonal matrix with d onits diagonal.• Laplacian matrix: The laplacian matrix of a graph G iscomputed from L(G) = (D − A), where D is the weighteddegree matrix <strong>and</strong> A is the similarity matrix.IV. GRAPH PARTITIONINGThe Ncut approach uses the algebraic properties of the laplacianmatrix to separate the nodes according to the dissimilarity betweenthem. In graph theoretic language, it is called cut:∑<strong>Cut</strong>(S 1, S 2) = w(u, v), u ∈ S 1, v ∈ S 2 (2)where S 1 <strong>and</strong> S 2 are two disjoint sets in a graph. Instead of usingthe total edge weight connection, this method computes the cutcost as a fraction of the total edge connections to all the nodes inthe graph:<strong>Cut</strong>(S1, S2) <strong>Cut</strong>(S1, S2)N<strong>Cut</strong>(S 1, S 2) = + (3)SumCon(S 1, V ) SumCon(S 2, V )where SumCon(S, V ) is the total connection from nodes in theset S with all nodes in V . Exp<strong>and</strong>ing this equation the followingequation can be found:min xN<strong>Cut</strong>(x) = min yy T (D − A)yy T DyThis equation, called Rayleigh quotient, has a property that it canbe minimized by the smallest eigenvector x 0 of the Rayleigh quotientsmatrix (in this case, the Laplacian matrix) <strong>and</strong> its minimumvalue is the corresponding eigenvalue λ 0. So, the <strong>Normalized</strong> cutcan be minimized by solving a generalized eigenvalue system asshown below.(D − A)y = λDy (5)Because of the first Laplacians matrix smallest eigenvalue is 0,the second smallest eigenvalue is the real valued solution to thenormalized cut problem <strong>and</strong> its corresponding eigenvector can tellexactly how to partition the graph just by separating the nodesrepresented by the positive values in the eigenvector from thenegative ones.V. EXPERIMENTAL RESULTSWe applied the conversion methods <strong>and</strong> the segmentation strategypresented in yeast cells images, thanks to its importancein several chemical processes <strong>and</strong> previous related works [5].Applying the pixel affinity method to generate a graph the resultsare showed in Figure 1. The original image, Figure 1(a) is convertedinto a graph using the pixel affinity method. After, the eingenvalues<strong>and</strong> eigenvectors are calculated. The sign of the second smallesteigenvectors values provides the partition presented on Figure 1(b).(4)shows the cells separated from the background (first iteration);Figures 2(c) <strong>and</strong> (d) show the cells grouped by their size similarities(second iteration).(a)(c)Figure 2. (a)Yeast original image; (b) yeast segmentation by WT <strong>and</strong>N<strong>Cut</strong>; (c), (d) yeast segmentation grouped by area.(b)(d)VI. CONCLUSIONS AND PERSPECTIVESOur experiments were satisfactory to group the imageregions that represent semantically the yest cells, whenWT was used. Minimizing the <strong>Normalized</strong> <strong>Cut</strong> is a NPcomplete[1], <strong>and</strong> the comparison between the two presentedmethods of image conversion showed that the performance ishigher using the Hierachical <strong>Watershed</strong> Transform, becauseit simplifies the graph in a lower number of nodes (differentfrom [2]). The studies about the Ncut <strong>and</strong> the spectral graphtheory allow numerous combinations of methods due to itsversatility. Once you can represent the problem using a graph<strong>and</strong> determine the similarity matrix, the grouping algorithmwill be similars. In this way, the properties chosen to computethe edge’s weights are importants for the final result.In order to improve our results, future works can combinethe image conversion methods presented <strong>and</strong> consider theregion’s shape as a similarity criterion.REFERENCES[1] J. Shi, J. Malik. <strong>Normalized</strong> cuts <strong>and</strong> image segmentation.IEEE Transactions on Pattern Analysis <strong>and</strong> Machine IntelligencePAMI, vol. 22, no. 8, pp. 888-905, 2000.[2] F. C. Monteiro, A. Campilho. <strong>Watershed</strong> framework to regionbasedimage segmentation. In: Proc. Of IEEE 19th InternationalConference on Pattern Recognition- ICPR, pp. 1-4, 2008.Figure 1.affinity).(a)(b)(a)Yeast original image; (b) yeast segmentation by N<strong>Cut</strong> (pixelFigure 2 shows the results of the segmentation process usingthe <strong>Watershed</strong> Transform (WT) <strong>and</strong> <strong>Normalized</strong> <strong>Cut</strong>. Figure 2(b)[3] F. Meyer, P. Maragos. Multiscale Morphological <strong>Segmentation</strong>sbased on <strong>Watershed</strong>, Flooding <strong>and</strong> Eikonal PDE. Scale-Space, pp. 1-12, 1999.[4] M. A. G. Carvalho. Hierarchical image analysis through thetree of critical lakes (in portuguese). In PhD Thesis, Electrical<strong>and</strong> Computer Engineering Faculty, University of CampinasUNICAMP, Brazil, 2004.[5] M. A. G. Carvalho, T. W. Pinto. Comparing yeast cells segmentationthrough hierarchical trees. In: Proc. Of InternationalConference on Computer Vision Theory <strong>and</strong> Applications -VISAPP, Setbal - Portugal. v. 1. p. 515-518, 2006.