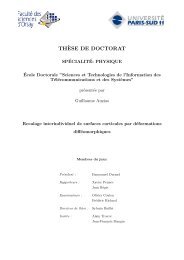
NEURORADIOLOGY: <strong>Hippocampal</strong> <strong>Sclerosis</strong> <strong>in</strong> <strong>Temporal</strong> <strong>Lobe</strong> <strong>Epilepsy</strong>Henry et alp<strong>at</strong>ients. Examples of result<strong>in</strong>g structures<strong>in</strong> control subjects and p<strong>at</strong>ients with malrot<strong>at</strong>ionsand those without are shown( Fig 5 ). The mean subregional hippocampalvolumes <strong>in</strong> control subjects and p<strong>at</strong>ientsare displayed <strong>in</strong> Table 3. As expected,the average volume of the CA1–CA3 regionappeared smaller for sclerotic hippocampi.Surpris<strong>in</strong>gly, CA4 and thedent<strong>at</strong>e gyrus were slightly larger on thecontral<strong>at</strong>eral side <strong>in</strong> p<strong>at</strong>ients. We observedtwo hippocampal subregions, oneconsist<strong>in</strong>g predom<strong>in</strong>antly of the l<strong>at</strong>eralAmmon horn and the other consist<strong>in</strong>gpredom<strong>in</strong>antly of dent<strong>at</strong>e gyrus with CA4,th<strong>at</strong> were slightly smaller on the left sideof healthy subjects than on the right.This permitted us to compare the r<strong>at</strong>ioof l<strong>at</strong>eral Ammon horn (CA1–CA3) todent<strong>at</strong>e CA4 <strong>in</strong> healthy subjects withth<strong>at</strong> <strong>in</strong> p<strong>at</strong>ients with TLE.P<strong>at</strong>ient subregional measurementswith respect to the control popul<strong>at</strong>ion areshown <strong>in</strong> Figure 6 . The values <strong>in</strong> healthycontrol subjects were, on average, slightlysmaller on the left side than on the rightside for both CA1–CA3 volume and CA4and dent<strong>at</strong>e gyrus volume. Mean AIfor CA1–CA3 of the entire hippocampalbody was 0.12 (range, 2 0.04 to 0.47);mean AI for volume per section of CA1–CA3 was 0.06 (range, 2 0.20 to 0.34);mean AI for CA4 and dent<strong>at</strong>e gyrus ofthe entire body was 0.06 (range, 2 0.06to 0.22); mean AI for volume per sectionof CA4 and dent<strong>at</strong>e gyrus was 0.00(range, 2 0.24 to 0.18); and mean r<strong>at</strong>ioof AIs for CA1–CA3 to CA4 and dent<strong>at</strong>egyrus of the entire body was 0.06(range, 2 0.08 to 0.34). The volume ofthe CA1–CA3 subregion was less thanthe mean volume <strong>in</strong> control subjects onboth sides <strong>in</strong> all p<strong>at</strong>ients but p<strong>at</strong>ient 1.The average volume per section wasmore sensitive than the entire volume.Interest<strong>in</strong>gly, the r<strong>at</strong>io of CA1–CA3 toCA4 and the dent<strong>at</strong>e gyrus was less thanthe mean r<strong>at</strong>io <strong>in</strong> control subjects <strong>in</strong>all p<strong>at</strong>ients on both sides of the hippocampus.Furthermore, <strong>in</strong> six of eightp<strong>at</strong>ients, the r<strong>at</strong>io of CA1–CA3 to CA4and dent<strong>at</strong>e gyrus on the side of ictalonset was less than the range <strong>in</strong> thecontrol group for th<strong>at</strong> side ( Fig 6e ). Volumetricasymmetry of the hippocampalCA1–CA3 subregions was observed <strong>in</strong>Table 3Volume of <strong>Hippocampal</strong> Body Subregions on T2-weighted MR ImagesVolume (mm 3 )five p<strong>at</strong>ients with TLE and HS. P<strong>at</strong>ient 3had substantial volume reduction comparedwith values <strong>in</strong> control subjectsfor both CA1–CA3 and CA4 and dent<strong>at</strong>egyrus and a lower asymmetry <strong>in</strong>dexfor the r<strong>at</strong>io than for both volumesControl GroupP<strong>at</strong>ient GroupRight Left Ictal Onset Side Contral<strong>at</strong>eral SideCA1–CA3Whole body 238 6 88 207 6 50 130 6 61 194 6 33Volume per section 21 6 4 20 6 3 11 6 4 19 6 1CA4 and dent<strong>at</strong>e gyrusWhole body 172 6 46 162 6 45 166 6 47 180 6 17Volume per section 16 6 3 15 6 3 15 6 4 18 6 2Note.—D<strong>at</strong>a are means 6 standard devi<strong>at</strong>ions.Figure 5Figure 5: Manually segmented volumes of the two subregions of body of hippocampus (CA1–3[dark blue] and CA4 and dent<strong>at</strong>e gyrus [light blue]) <strong>in</strong> four control subjects ( h2 , h3 , h1 , and h10 )and four p<strong>at</strong>ients with epilepsy ( t3 , t5 , t6 , and t8 ) <strong>in</strong> the slightly oblique coronal view, with the leftside of the bra<strong>in</strong> on right side of the image. Images <strong>in</strong> subjects 1 and 10 show unil<strong>at</strong>eral malrot<strong>at</strong>ionof the hippocampus. Image <strong>in</strong> p<strong>at</strong>ient 3 shows left HS, image <strong>in</strong> p<strong>at</strong>ient 5 shows right HS, andimages <strong>in</strong> p<strong>at</strong>ients 6 and 8 show left HS with malrot<strong>at</strong>ion of hippocampus.separ<strong>at</strong>ely. The distribution of <strong>at</strong>rophy <strong>in</strong>five p<strong>at</strong>ients was consistent with Ammonhorn sclerosis, while the distribution of<strong>at</strong>rophy <strong>in</strong> p<strong>at</strong>ient 3 was consistent withcomb<strong>in</strong>ed end-folium and Ammon hornsclerosis. The sclerosis was not detected206 radiology.rsna.org n Radiology: Volume 261: Number 1—October 2011
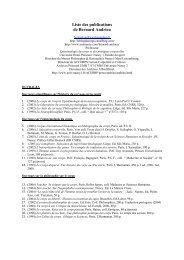
NEURORADIOLOGY: <strong>Hippocampal</strong> <strong>Sclerosis</strong> <strong>in</strong> <strong>Temporal</strong> <strong>Lobe</strong> <strong>Epilepsy</strong>Henry et alFigure 6Figure 6: (a–e) Graphs of hippocampal subregional volumetricd<strong>at</strong>a. DG = dent<strong>at</strong>e gyrus. Paired graphs for each measurementshow d<strong>at</strong>a by side <strong>in</strong> the left graph, and AI d<strong>at</strong>a <strong>in</strong> the right graph.Healthy subjects’ values are pooled <strong>in</strong> a s<strong>in</strong>gle column to the left ofeach graph, with each p<strong>at</strong>ient’s d<strong>at</strong>a displayed separ<strong>at</strong>ely. Horizontall<strong>in</strong>es facilit<strong>at</strong>e comparison of values <strong>in</strong> p<strong>at</strong>ients with TLEwith the range of values <strong>in</strong> the control group. For d<strong>at</strong>a by side,the lowest value <strong>in</strong> the control group is <strong>in</strong>dic<strong>at</strong>ed by a color-codeddotted l<strong>in</strong>e for side, except <strong>in</strong> c and d , <strong>in</strong> which one l<strong>in</strong>e appearsbecause right and left sides had the same lowest values <strong>in</strong> thecontrol group; for AI d<strong>at</strong>a, a pair of solid horizontal l<strong>in</strong>es <strong>in</strong>dic<strong>at</strong>eshighest and lowest values <strong>in</strong> control group.<strong>in</strong> p<strong>at</strong>ients 1 or 7 with subregional volumetryof the hippocampal body. Reproducibilityresults are given <strong>in</strong> AppendixE2 (onl<strong>in</strong>e). Briefly, results were betterfor measurements based on the volumeper section than for measurementsbased on the entire body (rel<strong>at</strong>ive <strong>in</strong>dexvalues averaged for both right- and leftsidedCA1–CA3 and both right- andleft-sided CA4 and dent<strong>at</strong>e gyrus <strong>in</strong> fivesubjects: 12% for entire body, 5% forvolume per section). This was expectedbecause of the limited number of sections(about 10), which makes an error<strong>in</strong> even one section become an errorof about 10% for the complete volume.Volumes for the second segment<strong>at</strong>ionwere larger than those for the first segment<strong>at</strong>ion,with two exceptions (out of40). This can be expla<strong>in</strong>ed by the factth<strong>at</strong> most borders are made of partialvolumes between two or more structuresand the fact th<strong>at</strong> the threshold is subjective.F<strong>in</strong>ally, errors were larger forCA4 and the dent<strong>at</strong>e gyrus than for theCA1–CA3 region (rel<strong>at</strong>ive <strong>in</strong>dex valuesfor the volume per section averaged forthe five subjects for both right- and leftsidedCA1–3, 3%; rel<strong>at</strong>ive <strong>in</strong>dex valuesfor the volume per section averagedfor the five subjects for both right- andleft-sided CA4 and dent<strong>at</strong>e gyrus, 6%).Overall, variability between these twosets of segment<strong>at</strong>ions was lower than th<strong>at</strong>between the healthy control subjects foreach type of measurement.In summary, high-sp<strong>at</strong>ial-resolutionhigh-contrast 7-T MR imag<strong>in</strong>g revealedthree f<strong>in</strong>d<strong>in</strong>gs th<strong>at</strong> cl<strong>in</strong>ical MR imag<strong>in</strong>g <strong>in</strong>p<strong>at</strong>ients with mesial TLE did not. First,most of the p<strong>at</strong>ients <strong>in</strong> whom cl<strong>in</strong>icalRadiology: Volume 261: Number 1—October 2011 n radiology.rsna.org 207