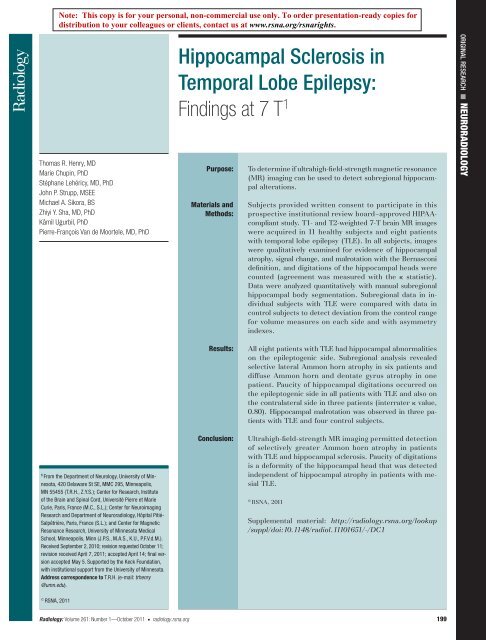
Hippocampal Sclerosis in Temporal Lobe Epilepsy: Findings at 7 T 1
Hippocampal Sclerosis in Temporal Lobe Epilepsy: Findings at 7 T 1
Hippocampal Sclerosis in Temporal Lobe Epilepsy: Findings at 7 T 1

You also want an ePaper? Increase the reach of your titles
YUMPU automatically turns print PDFs into web optimized ePapers that Google loves.
NEURORADIOLOGY: <strong>Hippocampal</strong> <strong>Sclerosis</strong> <strong>in</strong> <strong>Temporal</strong> <strong>Lobe</strong> <strong>Epilepsy</strong>Henry et al26 years. The mean age of the rema<strong>in</strong><strong>in</strong>geight p<strong>at</strong>ients with TLE was 28 years.The cl<strong>in</strong>ical characteristics of the p<strong>at</strong>ientsare summarized <strong>in</strong> Table 1 .Qualit<strong>at</strong>ive Visual AssessmentIn control subjects, the <strong>in</strong>ternal structurewas visible <strong>in</strong> all sections of the head,body, and tail of the hippocampus ( Fig 3 ).In each p<strong>at</strong>ient ( Table 2 ), the abnormalhippocampus had <strong>at</strong> least one ofthe follow<strong>in</strong>g signs: <strong>at</strong>rophy ( n = 7), T2-weighted hyper<strong>in</strong>tense signal ( n = 6),and fl<strong>at</strong>ten<strong>in</strong>g of the head ( n = 6). Ineach subject, hippocampal stri<strong>at</strong>ion andadditional detailed an<strong>at</strong>omic fe<strong>at</strong>ureswere clearly apparent. In each controlsubject, it was possible to del<strong>in</strong>e<strong>at</strong>e cont<strong>in</strong>uoushippocampal stri<strong>at</strong>ion. This whitem<strong>at</strong>ter band appeared to be less dist<strong>in</strong>guishedfrom surround<strong>in</strong>g gray m<strong>at</strong>ter<strong>in</strong> all sclerotic hippocampi. Thus, the partialloss of hippocampal stri<strong>at</strong>ion wasobserved <strong>in</strong> the hippocampus on the sideof ictal onset <strong>in</strong> all but two p<strong>at</strong>ients(p<strong>at</strong>ients 1 and 7) and <strong>in</strong> none of thecontrol subjects. Def<strong>in</strong>ite hippocampalmalrot<strong>at</strong>ions were observed <strong>in</strong> three p<strong>at</strong>ients;they were seen twice <strong>in</strong> p<strong>at</strong>ientswith ipsil<strong>at</strong>eral onset and once <strong>in</strong> a p<strong>at</strong>ientwith contral<strong>at</strong>eral to ictal onset( Fig 4 ). Malrot<strong>at</strong>ions were observed <strong>in</strong>four control subjects: They were observedbil<strong>at</strong>erally <strong>in</strong> subject 1 and on theleft side <strong>in</strong> subjects 6, 10, and 11. Thedeterm<strong>in</strong><strong>at</strong>ion of malrot<strong>at</strong>ion showed novari<strong>at</strong>ion between the first and secondobserv<strong>at</strong>ions <strong>in</strong> 18 of 19 subjects; however,one healthy control subject (subject4) was r<strong>at</strong>ed as hav<strong>in</strong>g bil<strong>at</strong>eralhippocampal malrot<strong>at</strong>ion <strong>at</strong> the secondview<strong>in</strong>g but not <strong>at</strong> the first. R<strong>at</strong><strong>in</strong>gsof hippocampal size, signal, shape, andstri<strong>at</strong>ion did not vary between the firstand second view<strong>in</strong>gs.Each p<strong>at</strong>ient had either no or onehippocampal digit<strong>at</strong>ion on the side ofictal onset ( Table 2 ). Three p<strong>at</strong>ients alsohad either no or one contral<strong>at</strong>eral hippocampaldigit<strong>at</strong>ion. Several p<strong>at</strong>ientshad def<strong>in</strong>ite hippocampal <strong>at</strong>rophy. Interest<strong>in</strong>gly,one p<strong>at</strong>ient (p<strong>at</strong>ient 1) hadbil<strong>at</strong>eral nondigit<strong>at</strong>ed hippocampalheads but only mild hippocampal <strong>at</strong>rophyon the epileptogenic side and contral<strong>at</strong>eralnormal hippocampal volumeFigure 2Figure 2: Manual segment<strong>at</strong>ion of two subregions of body of hippocampus on T2-weighted 7-T MRimages <strong>in</strong> subject 2 (24-year-old man). (a, b) Most posterior coronal section <strong>in</strong> (a) head and (b) bodyof hippocampus, as the image on the left of these pairs. Red cross marks the same po<strong>in</strong>t on the pairedcoronal and sagittal images, and on sagittal section (as the image on the right of these pairs) <strong>in</strong>dic<strong>at</strong>es levelof coronal section (front is on left side of sagittal image). (c) Limits of CA1–CA3 (dark blue) and CA4 anddent<strong>at</strong>e gyrus (light blue) regions on coronal section <strong>in</strong> middle of body (with no colored subregions on leftimage and colored subregions on middle image, both show<strong>in</strong>g the same image plane), as <strong>in</strong>dic<strong>at</strong>ed on thesagittal section (right image). (d) Three-dimensional render<strong>in</strong>g of two subregions <strong>in</strong> body of hippocampus,displayed separ<strong>at</strong>ely (left, with CA1–CA3 <strong>in</strong> dark blue, and middle, with CA4 and dent<strong>at</strong>e gyrus <strong>in</strong> light blue)and together (right).( Fig 4, A ). All healthy subjects had twoor three bil<strong>at</strong>eral digit<strong>at</strong>ions of the hippocampalhead; however, one of these22 hippocampal heads had one digit<strong>at</strong>ion,consistent with reports of postmortemstud ies <strong>in</strong> cadavers withoutRadiology: Volume 261: Number 1—October 2011 n radiology.rsna.org 203
NEURORADIOLOGY: <strong>Hippocampal</strong> <strong>Sclerosis</strong> <strong>in</strong> <strong>Temporal</strong> <strong>Lobe</strong> <strong>Epilepsy</strong>Henry et alFigure 3Figure 4Figure 3: Coronal T2-weighted 7-T MR images through the, A , B , head, C ,body, and, D , tail of hippocampus <strong>in</strong> four control subjects (31-year-old man,24-year-old woman, 19-year-old woman, and 22-year-old man, respectively)show <strong>in</strong>ternal structure of hippocampus. <strong>Hippocampal</strong> stri<strong>at</strong>ion (arrows) wasvisible <strong>in</strong> all.Figure 4: Coronal T2-weighted 7-T MR images through, A , head and, B – D ,body of hippocampus <strong>in</strong> three p<strong>at</strong>ients. A , P<strong>at</strong>ient 1 (30-year-old woman).Absence of hippocampal digit<strong>at</strong>ions bil<strong>at</strong>erally and slightly <strong>in</strong>creased signal<strong>in</strong>tensity <strong>in</strong> head of right hippocampus. <strong>Hippocampal</strong> stri<strong>at</strong>ion was barely visible<strong>in</strong> head of right hippocampus (arrows). B , Body of left hippocampus <strong>in</strong> p<strong>at</strong>ient1 (arrow) had an unusual malrot<strong>at</strong>ed vertical shape. C , P<strong>at</strong>ient 3 (22-year-oldman). <strong>Hippocampal</strong> <strong>at</strong>rophy and <strong>in</strong>creased signal <strong>in</strong>tensity predom<strong>in</strong><strong>at</strong><strong>in</strong>g <strong>in</strong>CA4 and dent<strong>at</strong>e gyrus region <strong>in</strong> body of left hippocampus (arrow). D , P<strong>at</strong>ient 8(29-year-old woman) had hippocampal <strong>at</strong>rophy and <strong>in</strong>creased signal <strong>in</strong>tensitypredom<strong>in</strong><strong>at</strong><strong>in</strong>g <strong>in</strong> CA1–3 region <strong>in</strong> body of the left hippocampus (arrow). Thisp<strong>at</strong>ient also had globular hippocampal shape.bra<strong>in</strong> disease ( 28 ). With<strong>in</strong> and betweenthe two observers who each <strong>in</strong>dependentlycounted hippocampal digit<strong>at</strong>ionstwice, this method was used to gener<strong>at</strong>e25 <strong>in</strong>stances of complete agreementon all four read<strong>in</strong>gs among 38hippocampi <strong>in</strong> healthy subjects andp<strong>at</strong>ients with epilepsy. There were four<strong>in</strong>stances of <strong>in</strong>traobserver disagreementand n<strong>in</strong>e <strong>in</strong>stances of <strong>in</strong>terobserverdisagreement (complete d<strong>at</strong>a are given<strong>in</strong> Appendix E1 [onl<strong>in</strong>e]). When disagreementsoccurred, the number of digit<strong>at</strong>ionsreported never varied by morethan one (usually one digit<strong>at</strong>ion vs twodigit<strong>at</strong>ions or two vs three digit<strong>at</strong>ions).In determ<strong>in</strong><strong>in</strong>g paucity versus multiplicityof digit<strong>at</strong>ions <strong>in</strong> the 38 hippocampalheads, k values were 0.93 for <strong>in</strong>trar<strong>at</strong>eragreement <strong>in</strong> both r<strong>at</strong>ers and 0.80 for<strong>in</strong>terr<strong>at</strong>er agreement.Quantit<strong>at</strong>ive Evalu<strong>at</strong>ionSubregional segment<strong>at</strong>ion of the hippocampalbody on T2-weighted images provedfeasible <strong>in</strong> all control subjects and204 radiology.rsna.org n Radiology: Volume 261: Number 1—October 2011
NEURORADIOLOGY: <strong>Hippocampal</strong> <strong>Sclerosis</strong> <strong>in</strong> <strong>Temporal</strong> <strong>Lobe</strong> <strong>Epilepsy</strong>Henry et alTable 1Cl<strong>in</strong>ical Characteristics of P<strong>at</strong>ientsP<strong>at</strong>ient No./Age (y)/Sex<strong>Epilepsy</strong> Predispos<strong>in</strong>g FactorsAge <strong>at</strong> SeizureOnset (y)ElectroencephalographicIctal OnsetCl<strong>in</strong>ical MR Imag<strong>in</strong>gF<strong>in</strong>d<strong>in</strong>gSeizure Type1/30/FFebrile convulsions of <strong>in</strong>fancy, family 28 R temporal R MTS A, C, Ghistory of epilepsy2/25/M Gest<strong>at</strong>ional or per<strong>in</strong><strong>at</strong>al <strong>in</strong>jury 13 R temporal R MTS A, C, G, SE3/22/M Febrile convulsions of <strong>in</strong>fancy 5 L temporal L MTS A, C, G4/20/F None 14 L temporal L MTS A, C5/32/M Central nervous system <strong>in</strong>fection 28 R temporal R MTS A, C6/49/F None 11 L temporal L MTS A, C, G7/20/F None 17 L temporal L MTS A, C, G8/29/FGest<strong>at</strong>ional or per<strong>in</strong><strong>at</strong>al <strong>in</strong>jury andfamily history of epilepsy23 L temporal L MTS A, CNote.—A = aura, C = complex partial, G = generalized tonic-clonic, L = left, MTS = mesial temporal sclerosis, R = right, SE = generalized convulsive st<strong>at</strong>us epilepticus.Table 2Visual Assessment of Hippocampi <strong>in</strong> P<strong>at</strong>ients with TLEHeadBodyP<strong>at</strong>ient No. and SideIctal Onset SideShape Signal Intensity <strong>Hippocampal</strong> Stri<strong>at</strong>ion No. of Digit<strong>at</strong>ions Size Signal <strong>Hippocampal</strong> Stri<strong>at</strong>ionMR1Right Y Fl<strong>at</strong> 2 Fl<strong>at</strong>, partial 0 1 0 N ...Left N ... ... Less fl <strong>at</strong>, partial 0 ... ... ... Y2Right Y Fl<strong>at</strong> 2 Fl<strong>at</strong>, partial 0 3 3 Blurred ...Left N ... ... Less fl <strong>at</strong>, partial 1 ... ... Blurred but less ...3Right N ... ... ... 1 ... ... ... ...Left Y Fl<strong>at</strong> 2 Less visible, fl <strong>at</strong>, partial, 0 3 3 Visible, th<strong>in</strong>ner ...blurred4Right N ... ... Reduced visibility 3 ... ... ... ...Left Y Normal 2 Reduced visibility 1 0 1 Less visible ...5Right Y Fl<strong>at</strong> 2 Not visible 0 3 2 Less visible ...Left N ... ... ... 2 ... ... ... ...6Right N ... ... ... 3 ... ... ... ...Left Y Fl<strong>at</strong> 1 Th<strong>in</strong>, blurred 0 3 1 Blurred Y7Right N ... ... ... 2 ... ... ... ...Left Y Partially 0 ... 1 0 1 Normal ...fl a t8Right N ... ... Visible, <strong>in</strong>terrupted 2 ... ... ... ...Left Y Fl<strong>at</strong> 2 Not visible 0 3 3 Visible, th<strong>in</strong>ner YNote.—Atrophy and T2-weighted signal <strong>in</strong>tensity r<strong>at</strong><strong>in</strong>gs: 0 = normal, 1 = possibly present (mild), 2 = probably present (moder<strong>at</strong>e), 3 = defi nitely present (severe). MR = hippocampal malrot<strong>at</strong>ion,N = no, NA = not applicable, Y = yes.Radiology: Volume 261: Number 1—October 2011 n radiology.rsna.org 205
NEURORADIOLOGY: <strong>Hippocampal</strong> <strong>Sclerosis</strong> <strong>in</strong> <strong>Temporal</strong> <strong>Lobe</strong> <strong>Epilepsy</strong>Henry et alp<strong>at</strong>ients. Examples of result<strong>in</strong>g structures<strong>in</strong> control subjects and p<strong>at</strong>ients with malrot<strong>at</strong>ionsand those without are shown( Fig 5 ). The mean subregional hippocampalvolumes <strong>in</strong> control subjects and p<strong>at</strong>ientsare displayed <strong>in</strong> Table 3. As expected,the average volume of the CA1–CA3 regionappeared smaller for sclerotic hippocampi.Surpris<strong>in</strong>gly, CA4 and thedent<strong>at</strong>e gyrus were slightly larger on thecontral<strong>at</strong>eral side <strong>in</strong> p<strong>at</strong>ients. We observedtwo hippocampal subregions, oneconsist<strong>in</strong>g predom<strong>in</strong>antly of the l<strong>at</strong>eralAmmon horn and the other consist<strong>in</strong>gpredom<strong>in</strong>antly of dent<strong>at</strong>e gyrus with CA4,th<strong>at</strong> were slightly smaller on the left sideof healthy subjects than on the right.This permitted us to compare the r<strong>at</strong>ioof l<strong>at</strong>eral Ammon horn (CA1–CA3) todent<strong>at</strong>e CA4 <strong>in</strong> healthy subjects withth<strong>at</strong> <strong>in</strong> p<strong>at</strong>ients with TLE.P<strong>at</strong>ient subregional measurementswith respect to the control popul<strong>at</strong>ion areshown <strong>in</strong> Figure 6 . The values <strong>in</strong> healthycontrol subjects were, on average, slightlysmaller on the left side than on the rightside for both CA1–CA3 volume and CA4and dent<strong>at</strong>e gyrus volume. Mean AIfor CA1–CA3 of the entire hippocampalbody was 0.12 (range, 2 0.04 to 0.47);mean AI for volume per section of CA1–CA3 was 0.06 (range, 2 0.20 to 0.34);mean AI for CA4 and dent<strong>at</strong>e gyrus ofthe entire body was 0.06 (range, 2 0.06to 0.22); mean AI for volume per sectionof CA4 and dent<strong>at</strong>e gyrus was 0.00(range, 2 0.24 to 0.18); and mean r<strong>at</strong>ioof AIs for CA1–CA3 to CA4 and dent<strong>at</strong>egyrus of the entire body was 0.06(range, 2 0.08 to 0.34). The volume ofthe CA1–CA3 subregion was less thanthe mean volume <strong>in</strong> control subjects onboth sides <strong>in</strong> all p<strong>at</strong>ients but p<strong>at</strong>ient 1.The average volume per section wasmore sensitive than the entire volume.Interest<strong>in</strong>gly, the r<strong>at</strong>io of CA1–CA3 toCA4 and the dent<strong>at</strong>e gyrus was less thanthe mean r<strong>at</strong>io <strong>in</strong> control subjects <strong>in</strong>all p<strong>at</strong>ients on both sides of the hippocampus.Furthermore, <strong>in</strong> six of eightp<strong>at</strong>ients, the r<strong>at</strong>io of CA1–CA3 to CA4and dent<strong>at</strong>e gyrus on the side of ictalonset was less than the range <strong>in</strong> thecontrol group for th<strong>at</strong> side ( Fig 6e ). Volumetricasymmetry of the hippocampalCA1–CA3 subregions was observed <strong>in</strong>Table 3Volume of <strong>Hippocampal</strong> Body Subregions on T2-weighted MR ImagesVolume (mm 3 )five p<strong>at</strong>ients with TLE and HS. P<strong>at</strong>ient 3had substantial volume reduction comparedwith values <strong>in</strong> control subjectsfor both CA1–CA3 and CA4 and dent<strong>at</strong>egyrus and a lower asymmetry <strong>in</strong>dexfor the r<strong>at</strong>io than for both volumesControl GroupP<strong>at</strong>ient GroupRight Left Ictal Onset Side Contral<strong>at</strong>eral SideCA1–CA3Whole body 238 6 88 207 6 50 130 6 61 194 6 33Volume per section 21 6 4 20 6 3 11 6 4 19 6 1CA4 and dent<strong>at</strong>e gyrusWhole body 172 6 46 162 6 45 166 6 47 180 6 17Volume per section 16 6 3 15 6 3 15 6 4 18 6 2Note.—D<strong>at</strong>a are means 6 standard devi<strong>at</strong>ions.Figure 5Figure 5: Manually segmented volumes of the two subregions of body of hippocampus (CA1–3[dark blue] and CA4 and dent<strong>at</strong>e gyrus [light blue]) <strong>in</strong> four control subjects ( h2 , h3 , h1 , and h10 )and four p<strong>at</strong>ients with epilepsy ( t3 , t5 , t6 , and t8 ) <strong>in</strong> the slightly oblique coronal view, with the leftside of the bra<strong>in</strong> on right side of the image. Images <strong>in</strong> subjects 1 and 10 show unil<strong>at</strong>eral malrot<strong>at</strong>ionof the hippocampus. Image <strong>in</strong> p<strong>at</strong>ient 3 shows left HS, image <strong>in</strong> p<strong>at</strong>ient 5 shows right HS, andimages <strong>in</strong> p<strong>at</strong>ients 6 and 8 show left HS with malrot<strong>at</strong>ion of hippocampus.separ<strong>at</strong>ely. The distribution of <strong>at</strong>rophy <strong>in</strong>five p<strong>at</strong>ients was consistent with Ammonhorn sclerosis, while the distribution of<strong>at</strong>rophy <strong>in</strong> p<strong>at</strong>ient 3 was consistent withcomb<strong>in</strong>ed end-folium and Ammon hornsclerosis. The sclerosis was not detected206 radiology.rsna.org n Radiology: Volume 261: Number 1—October 2011
NEURORADIOLOGY: <strong>Hippocampal</strong> <strong>Sclerosis</strong> <strong>in</strong> <strong>Temporal</strong> <strong>Lobe</strong> <strong>Epilepsy</strong>Henry et alFigure 6Figure 6: (a–e) Graphs of hippocampal subregional volumetricd<strong>at</strong>a. DG = dent<strong>at</strong>e gyrus. Paired graphs for each measurementshow d<strong>at</strong>a by side <strong>in</strong> the left graph, and AI d<strong>at</strong>a <strong>in</strong> the right graph.Healthy subjects’ values are pooled <strong>in</strong> a s<strong>in</strong>gle column to the left ofeach graph, with each p<strong>at</strong>ient’s d<strong>at</strong>a displayed separ<strong>at</strong>ely. Horizontall<strong>in</strong>es facilit<strong>at</strong>e comparison of values <strong>in</strong> p<strong>at</strong>ients with TLEwith the range of values <strong>in</strong> the control group. For d<strong>at</strong>a by side,the lowest value <strong>in</strong> the control group is <strong>in</strong>dic<strong>at</strong>ed by a color-codeddotted l<strong>in</strong>e for side, except <strong>in</strong> c and d , <strong>in</strong> which one l<strong>in</strong>e appearsbecause right and left sides had the same lowest values <strong>in</strong> thecontrol group; for AI d<strong>at</strong>a, a pair of solid horizontal l<strong>in</strong>es <strong>in</strong>dic<strong>at</strong>eshighest and lowest values <strong>in</strong> control group.<strong>in</strong> p<strong>at</strong>ients 1 or 7 with subregional volumetryof the hippocampal body. Reproducibilityresults are given <strong>in</strong> AppendixE2 (onl<strong>in</strong>e). Briefly, results were betterfor measurements based on the volumeper section than for measurementsbased on the entire body (rel<strong>at</strong>ive <strong>in</strong>dexvalues averaged for both right- and leftsidedCA1–CA3 and both right- andleft-sided CA4 and dent<strong>at</strong>e gyrus <strong>in</strong> fivesubjects: 12% for entire body, 5% forvolume per section). This was expectedbecause of the limited number of sections(about 10), which makes an error<strong>in</strong> even one section become an errorof about 10% for the complete volume.Volumes for the second segment<strong>at</strong>ionwere larger than those for the first segment<strong>at</strong>ion,with two exceptions (out of40). This can be expla<strong>in</strong>ed by the factth<strong>at</strong> most borders are made of partialvolumes between two or more structuresand the fact th<strong>at</strong> the threshold is subjective.F<strong>in</strong>ally, errors were larger forCA4 and the dent<strong>at</strong>e gyrus than for theCA1–CA3 region (rel<strong>at</strong>ive <strong>in</strong>dex valuesfor the volume per section averaged forthe five subjects for both right- and leftsidedCA1–3, 3%; rel<strong>at</strong>ive <strong>in</strong>dex valuesfor the volume per section averagedfor the five subjects for both right- andleft-sided CA4 and dent<strong>at</strong>e gyrus, 6%).Overall, variability between these twosets of segment<strong>at</strong>ions was lower than th<strong>at</strong>between the healthy control subjects foreach type of measurement.In summary, high-sp<strong>at</strong>ial-resolutionhigh-contrast 7-T MR imag<strong>in</strong>g revealedthree f<strong>in</strong>d<strong>in</strong>gs th<strong>at</strong> cl<strong>in</strong>ical MR imag<strong>in</strong>g <strong>in</strong>p<strong>at</strong>ients with mesial TLE did not. First,most of the p<strong>at</strong>ients <strong>in</strong> whom cl<strong>in</strong>icalRadiology: Volume 261: Number 1—October 2011 n radiology.rsna.org 207
NEURORADIOLOGY: <strong>Hippocampal</strong> <strong>Sclerosis</strong> <strong>in</strong> <strong>Temporal</strong> <strong>Lobe</strong> <strong>Epilepsy</strong>Henry et alMR imag<strong>in</strong>g revealed only <strong>at</strong>rophy overthe entire hippocampal form<strong>at</strong>ion had<strong>at</strong>rophy specific to the ma<strong>in</strong> portion ofthe Ammon horn, with little or no <strong>at</strong>rophy<strong>in</strong> the dent<strong>at</strong>e gyrus. Second, absenceor paucity of hippocampal headdigit<strong>at</strong>ions was observed on the epileptogenicside <strong>in</strong> all of the p<strong>at</strong>ients withTLE and <strong>in</strong> only one of the healthy controlsubjects on only one side. Third, the<strong>in</strong>ternal structure of malrot<strong>at</strong>ed hippocampiwas clearly visible, unlike <strong>in</strong>previous 1.5-T studies ( 17 ).DiscussionOur f<strong>in</strong>d<strong>in</strong>gs suggest th<strong>at</strong> absence orpaucity of digit<strong>at</strong>ions of the hippocampalhead may represent a specific hippocampaldeformity <strong>in</strong> p<strong>at</strong>ients with mesialTLE. This deformity occurred most often<strong>in</strong> <strong>at</strong>rophic hippocampi on the sideof electroencephalographic ictal onset,but it also occurred on 7-T MR images<strong>in</strong> non<strong>at</strong>rophic hippocampi contral<strong>at</strong>eralto ictal onset. P<strong>at</strong>ients with moder<strong>at</strong>e orsevere hippocampal <strong>at</strong>rophy have beenreported to have loss of these digit<strong>at</strong>ions<strong>at</strong> cl<strong>in</strong>ical MR imag<strong>in</strong>g ( 9 ). Theselower-sp<strong>at</strong>ial-resolution and lowercontrast-resolutionstudies may enableus to detect reduced digit<strong>at</strong>ions on thebasis of <strong>at</strong>rophy-rel<strong>at</strong>ed enlargement ofthe adjacent ventricle so th<strong>at</strong> the superiorhippocampal surface has high contrastaga<strong>in</strong>st a widened cerebrosp<strong>in</strong>al fluidspace. At 7 T, we consistently detectedthe th<strong>in</strong> white m<strong>at</strong>ter layer of the alveus,situ<strong>at</strong>ed between the gray m<strong>at</strong>ter massesof the hippocampus and amygdala, to accur<strong>at</strong>elydef<strong>in</strong>e the hippocampal surface,<strong>in</strong>clud<strong>in</strong>g its gyral p<strong>at</strong>tern, even <strong>in</strong> the absenceof moder<strong>at</strong>e or severe hippocampal<strong>at</strong>rophy with enlarged cerebrosp<strong>in</strong>al fluidspaces. Normal gyral morphology of thehippocampal head may be absent or reduced<strong>in</strong> many p<strong>at</strong>ients with mesial TLEand to some extent may be <strong>in</strong>dependentof hippocampal <strong>at</strong>rophy. Tissue exam<strong>in</strong><strong>at</strong>ionwould be necessary to determ<strong>in</strong>eif this hippocampal deformity representsa malform<strong>at</strong>ion of hippocampal developmentwith microstructural dysplasia.Others have questioned whether subtledysplasias may be associ<strong>at</strong>ed withHS. Isol<strong>at</strong>ed hippocampal tectonic malform<strong>at</strong>ionsare detected microscopicallywith<strong>in</strong> small portions of sclerotic hippocampi<strong>in</strong> p<strong>at</strong>ients with surgically tre<strong>at</strong>edTLE ( 29 ). Isol<strong>at</strong>ed hippocampal dysplasiashave rarely been reported <strong>in</strong> studies ofmesial TLE with tissue correl<strong>at</strong>ion to cl<strong>in</strong>icalMR imag<strong>in</strong>g ( 30,31 ). In syndromesother than TLE, cl<strong>in</strong>ical MR imag<strong>in</strong>g candepict hippocampal hypertrophy andother large hippocampal malform<strong>at</strong>ions<strong>in</strong> associ<strong>at</strong>ion with extrahippocampalmalform<strong>at</strong>ions of cortical development( 17,32–34 ). An isol<strong>at</strong>ed hippocampalmalform<strong>at</strong>ion, malrot<strong>at</strong>ion of the hippocampalbody, has been reported <strong>at</strong>MR imag<strong>in</strong>g not only <strong>in</strong> p<strong>at</strong>ients withmesial TLE but also <strong>in</strong> healthy subjectswithout epilepsy ( 18,19 ). Here, 7-T MRimages clearly showed major <strong>in</strong>ternalstructures of the hippocampus and enableddetailed evalu<strong>at</strong>ion of normal andabnormal hippocampal fold<strong>in</strong>g and rot<strong>at</strong>ion.Ultrahigh-field-strength MR imag<strong>in</strong>gmay prove to be the preferredtechnique with which to study largeaffected and control groups and def<strong>in</strong>ebenign and abnormal hippocampalmalform<strong>at</strong>ions <strong>in</strong> rel<strong>at</strong>ionship to specificneurologic syndromes.The limit<strong>at</strong>ions of the current studyare largely rel<strong>at</strong>ed to the rel<strong>at</strong>ively smallnumber of subjects imaged and to the<strong>in</strong>complete development of 7-T bra<strong>in</strong>imag<strong>in</strong>g techniques. Our method forcount<strong>in</strong>g digit<strong>at</strong>ions of the hippocampalhead was associ<strong>at</strong>ed with concordant<strong>in</strong>terpret<strong>at</strong>ions across <strong>in</strong>dependent observers,but it has not been comparedwith an <strong>in</strong>dependent measure of theseconvolutions. Our <strong>in</strong>trahippocampal volumetrictechnique has not yet been valid<strong>at</strong>edfor reproducibility and rel<strong>at</strong>ionshipswith tissue f<strong>in</strong>d<strong>in</strong>gs. Larger groups ofhealthy control subjects, p<strong>at</strong>ients withmesial TLE, p<strong>at</strong>ients with epilepsy butnot TLE, and p<strong>at</strong>ients with nonepilepticbra<strong>in</strong> disease must be studied to determ<strong>in</strong>ethe specificity of our f<strong>in</strong>d<strong>in</strong>gs formesial TLE. Observ<strong>at</strong>ions regard<strong>in</strong>g apparenthippocampal deformity on 7-Timages <strong>in</strong> p<strong>at</strong>ients with mesial TLE shouldbe confirmed with histop<strong>at</strong>hologic exam<strong>in</strong><strong>at</strong>ionof tissue specimens <strong>at</strong> subsequentepilepsy surgery. Cadaveric imag<strong>in</strong>gshould be performed to confirmrel<strong>at</strong>ionships between submillimetric hippocampalsurface and <strong>in</strong>trahippocampalfe<strong>at</strong>ures of 7-T images and histologicresults. Avoid<strong>in</strong>g head motion enoughto benefit from the higher sp<strong>at</strong>ial resolutionwas a challenge <strong>in</strong> several subjects<strong>in</strong> this study. New str<strong>at</strong>egies willbe needed to permit rout<strong>in</strong>e acquisitionof images with submillimetric sp<strong>at</strong>ialresolution, particularly <strong>in</strong> p<strong>at</strong>ients withbra<strong>in</strong> disease. We did not have availablesoftware designed for autom<strong>at</strong>ed hippocampalsegment<strong>at</strong>ion and surface morphometry<strong>at</strong> 7-T-gener<strong>at</strong>ed sp<strong>at</strong>ial andcontrast resolution, such as th<strong>at</strong> whichis available for 1.5- and 3-T studies ( 35 ).The gre<strong>at</strong>er complexity of <strong>in</strong>trahippocampalsubstructures <strong>in</strong> the head and tailof the hippocampus limited our currentsubregional segment<strong>at</strong>ion approach tothe hippocampal body. If 7-T MR imag<strong>in</strong>gis developed to depict subtle hippocampalalter<strong>at</strong>ions reliably and thesealter<strong>at</strong>ions are shown to accur<strong>at</strong>ely def<strong>in</strong>ean<strong>at</strong>omic abnormalities, considerableadditional effort will be required toclarify their rel<strong>at</strong>ionships with epileptogenesisand to establish any useful role<strong>in</strong> presurgical evalu<strong>at</strong>ion of epilepsy. Our<strong>in</strong> vivo f<strong>in</strong>d<strong>in</strong>gs strongly support future efforts<strong>in</strong> the study of larger groups withimproved acquisition and image analysisprotocols specifically adapted to the <strong>in</strong>form<strong>at</strong>ionprovided by 7-T MR imag<strong>in</strong>g.Bra<strong>in</strong> imag<strong>in</strong>g with 7-T MR probablycan be used to fully def<strong>in</strong>e a widerange of macroscopically visible f<strong>in</strong>d<strong>in</strong>gs<strong>in</strong> p<strong>at</strong>ients with hippocampal sclerosis,<strong>in</strong>clud<strong>in</strong>g <strong>at</strong>rophy of hippocampal subregionsand deformities of the hippocampalhead and body. Future applic<strong>at</strong>ionsof 7-T MR imag<strong>in</strong>g <strong>in</strong> presurgical evalu<strong>at</strong>ionsmay benefit the numerous <strong>in</strong>dividualswith refractory mesial TLE who havenormal or nonspecifically abnormal bra<strong>in</strong>imag<strong>in</strong>g f<strong>in</strong>d<strong>in</strong>gs <strong>at</strong> cl<strong>in</strong>ical MR imag<strong>in</strong>g( 6–8 ). Increased sp<strong>at</strong>ial and contrastresolution <strong>at</strong> 7 T might enable unil<strong>at</strong>eraldetection of mild HS <strong>in</strong> p<strong>at</strong>ients currentlyconsidered to have MR-neg<strong>at</strong>iveTLE, lead<strong>in</strong>g to efficacious abl<strong>at</strong>ive surgery.Altern<strong>at</strong>ively, improved detectionof bil<strong>at</strong>eral HS <strong>in</strong> p<strong>at</strong>ients who currentlyhave only unil<strong>at</strong>eral hippocampal abnormalitiesdetected with cl<strong>in</strong>ical MR imag<strong>in</strong>gmight enable us to avoid <strong>in</strong>tracranial208 radiology.rsna.org n Radiology: Volume 261: Number 1—October 2011