A Review of the Pennsylvania Phosphorus Index ... - PennFuture
A Review of the Pennsylvania Phosphorus Index ... - PennFuture
A Review of the Pennsylvania Phosphorus Index ... - PennFuture

Create successful ePaper yourself
Turn your PDF publications into a flip-book with our unique Google optimized e-Paper software.
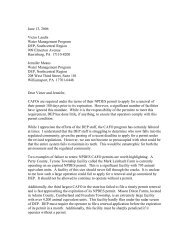
plotted (Figure 2). By lowering <strong>the</strong> P-<strong>Index</strong> ranking categories, P application restrictions wouldbe reduced or removed. For examples initially in <strong>the</strong> Very High P-<strong>Index</strong> category, PSC valuesnecessary to reduce <strong>the</strong> P-<strong>Index</strong> ranking to High and Medium were determined with <strong>the</strong>following exceptions. In one case, <strong>the</strong> minimum PSC (0.1) did not reduce <strong>the</strong> P-<strong>Index</strong> categoryfrom <strong>the</strong> Very High ranking. In 3 o<strong>the</strong>r cases, <strong>the</strong> minimum PSC only lowered <strong>the</strong> P-<strong>Index</strong> from<strong>the</strong> Very High to <strong>the</strong> High ranking. For examples with P-<strong>Index</strong> values in <strong>the</strong> High rank, PSCvalues necessary to reduce <strong>the</strong> P-<strong>Index</strong> to Medium were calculated.Quantity <strong>of</strong> P-<strong>Index</strong> change120100806040200P-<strong>Index</strong> change vs. PSCchange0 0.2 0.4 0.6 0.8 1y = 83.143x + 0.0752R² = 0.5791PI changeQuantity <strong>of</strong> PSC reduction from "Book value"Linear (PI change)Figure 2. Change <strong>of</strong> P-<strong>Index</strong> (PI) versus <strong>the</strong> reduction in PSC from “Book value.” Data adaptedfrom Kogelmann et al. 2004.Based upon this analysis, <strong>the</strong> reduction in PSC values was significantly correlated with <strong>the</strong>reductions in <strong>the</strong> P-<strong>Index</strong> ratings (P>.001; R2 = 0.58.). For each reduction in PSC <strong>of</strong> 0.1, acorresponding reduction <strong>of</strong> about 8 P-<strong>Index</strong> units is predicted, on average. This relationshipseems especially well correlated for reductions in PSC values from Book values <strong>of</strong> less than 0.3units.The increase variability in <strong>the</strong> relationship between PSC reductions and change in P-Indices as<strong>the</strong> level <strong>of</strong> PSC reduction increases may be related to <strong>the</strong> variability in <strong>the</strong> influence <strong>of</strong> <strong>the</strong>source and transport terms. Kogelmann et al (2004) found that about 50% <strong>of</strong> <strong>the</strong> P restrictionson farms in Lancaster County were due to high P sources, ei<strong>the</strong>r from high soil tests or highmanure P application rates. Transport factors were <strong>the</strong> primary concern in 21% <strong>of</strong> <strong>the</strong> cases andfor <strong>the</strong> remaindering 29%, both source and transport contributed equally. In Snyder County,transport factors and source factors were found to be about equal, with transport factorsshowing a slightly higher influence on P-<strong>Index</strong> rankings.Page 8