Journal of Business logistics, Vol. 28, no. 2, 2007 ... - Global Initiatives
Journal of Business logistics, Vol. 28, no. 2, 2007 ... - Global Initiatives
Journal of Business logistics, Vol. 28, no. 2, 2007 ... - Global Initiatives
Create successful ePaper yourself
Turn your PDF publications into a flip-book with our unique Google optimized e-Paper software.
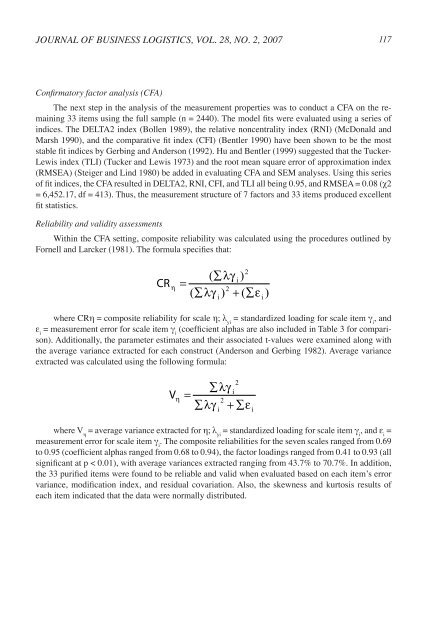
<strong>Journal</strong> <strong>of</strong> <strong>Business</strong> Logistics, <strong>Vol</strong>. <strong>28</strong>, No. 2, <strong>2007</strong> 117Confirmatory factor analysis (CFA)The next step in the analysis <strong>of</strong> the measurement properties was to conduct a CFA on the remaining33 items using the full sample (n = 2440). The model fits were evaluated using a series <strong>of</strong>indices. The DELTA2 index (Bollen 1989), the relative <strong>no</strong>ncentrality index (RNI) (McDonald andMarsh 1990), and the comparative fit index (CFI) (Bentler 1990) have been shown to be the moststable fit indices by Gerbing and Anderson (1992). Hu and Bentler (1999) suggested that the Tucker-Lewis index (TLI) (Tucker and Lewis 1973) and the root mean square error <strong>of</strong> approximation index(RMSEA) (Steiger and Lind 1980) be added in evaluating CFA and SEM analyses. Using this series<strong>of</strong> fit indices, the CFA resulted in DELTA2, RNI, CFI, and TLI all being 0.95, and RMSEA = 0.08 (χ2= 6,452.17, df = 413). Thus, the measurement structure <strong>of</strong> 7 factors and 33 items produced excellentfit statistics.Reliability and validity assessmentsWithin the CFA setting, composite reliability was calculated using the procedures outlined byFornell and Larcker (1981). The formula specifies that:CRη2( ∑λγi)=2( ∑λγ) + ( ∑εii)where CRη = composite reliability for scale η; λ yi= standardized loading for scale item γ i, andε i= measurement error for scale item γ i(coefficient alphas are also included in Table 3 for comparison).Additionally, the parameter estimates and their associated t-values were examined along withthe average variance extracted for each construct (Anderson and Gerbing 1982). Average varianceextracted was calculated using the following formula:Vη2i2i∑λγ=∑λγ+ ∑εiwhere V η= average variance extracted for η; λ yi= standardized loading for scale item γ i, and ε i=measurement error for scale item γ i. The composite reliabilities for the seven scales ranged from 0.69to 0.95 (coefficient alphas ranged from 0.68 to 0.94), the factor loadings ranged from 0.41 to 0.93 (allsignificant at p < 0.01), with average variances extracted ranging from 43.7% to 70.7%. In addition,the 33 purified items were found to be reliable and valid when evaluated based on each item’s errorvariance, modification index, and residual covariation. Also, the skewness and kurtosis results <strong>of</strong>each item indicated that the data were <strong>no</strong>rmally distributed.


