Journal of Business logistics, Vol. 28, no. 2, 2007 ... - Global Initiatives
Journal of Business logistics, Vol. 28, no. 2, 2007 ... - Global Initiatives
Journal of Business logistics, Vol. 28, no. 2, 2007 ... - Global Initiatives

You also want an ePaper? Increase the reach of your titles
YUMPU automatically turns print PDFs into web optimized ePapers that Google loves.
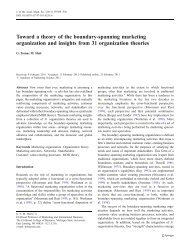
<strong>Journal</strong> <strong>of</strong> <strong>Business</strong> Logistics, <strong>Vol</strong>. <strong>28</strong>, No. 2, <strong>2007</strong> 121TABLE 5MEAN SCORES OF IDEAL AND AVERAGE QUALITY PROFILE VARIABLESQuality CharacteristicsIdealPr<strong>of</strong>ile ScoresAveragePr<strong>of</strong>ile ScoresDifference inMean Scores for Idealand Average CustomersMean Std. Dev. Mean Std. Dev. Mean SignificanceSemi Extended StrategyService Quality 6.77 0.54 6.25 0.82 0.52 p < 0.01Product Quality 6.53 0.56 5.74 1.01 0.79 p < 0.01e<strong>Business</strong> Quality 6.73 0.48 5.92 1.07 0.81 p < 0.01Fully Extended StrategyService Quality 6.82 0.30 6.01 0.95 0.81 p < 0.01Product Quality 6.41 0.78 5.23 1.14 1.18 p < 0.01e<strong>Business</strong> Quality 6.60 0.69 5.82 1.14 0.78 p < 0.01De-Coupled StrategyService Quality 6.57 0.62 5.77 1.04 0.80 p < 0.01Product Quality 6.22 0.64 5.30 0.94 0.92 p < 0.01e<strong>Business</strong> Quality 6.69 0.68 6.34 0.76 0.35 p < 0.05Centralized Extended StrategyService Quality 6.96 0.07 6.15 0.76 0.81 p < 0.01Product Quality 6.55 0.46 5.05 0.94 1.50 p < 0.01e<strong>Business</strong> Quality 6.79 0.51 5.95 0.94 0.84 p < 0.01To examine whether our ideal pr<strong>of</strong>iles provide strong explanatory power, we also examinedalternative “<strong>no</strong>n-ideal” models, where the “average customers” (those cases at the median on therepurchase intention scale) at each firm were used as the benchmark for pr<strong>of</strong>ile deviation scores foreach operational <strong>logistics</strong> strategy. In all four cases, the results support the <strong>no</strong>tion that calibratingideal quality pr<strong>of</strong>iles within strategy type produces stronger pr<strong>of</strong>ile deviation coefficients (Cohen etal. 2003) and greater explanatory power (Chow 1960) than the average benchmarks (<strong>no</strong>te that theideal pr<strong>of</strong>iles also achieve higher mean scores than the average pr<strong>of</strong>iles; see Table 5). For all models,the Variance Inflation Factors were lower than 1.80, indicating that multicollinearity does <strong>no</strong>t inhibitthe analysis (Mason and Perreault 1991).H 1-4predicted that the more similar the quality pr<strong>of</strong>ile is to that <strong>of</strong> the ideal pr<strong>of</strong>ile for its operational<strong>logistics</strong> strategy type, the greater is its outcome (measured as customers’ behavioral repurchaseintentions). Table 4 shows that, using OLS regression, the results reveal a significant, negativeeffect <strong>of</strong> the quality ideal pr<strong>of</strong>ile for semi extended (β = -0.26, p < 0.01, Adjusted R 2 = 0.32), fullyextended (β = -0.041, p < 0.01, Adjusted R 2 = 0.41), de-coupled (β = -0.43, p < 0.05, Adjusted R 2 =0.37), and centralized extended (β = -0.41, p < 0.01, Adjusted R 2 = 0.37) strategy types with repurchaseintentions as the criterion variable. Thus, all four hypotheses were supported. Additionally, sacrifice(SAC), as a control variable, was significant in all four equations. However, the control variable<strong>of</strong> online accessibility (OA) was significant in only the centralized-extended strategy model, whileattitude toward Internet ordering (ATT) did <strong>no</strong>t affect repurchase intentions in the four equations.33