SAND KEY BEACH RENOURISHMENT PROJECT ... - fsbpa
SAND KEY BEACH RENOURISHMENT PROJECT ... - fsbpa
SAND KEY BEACH RENOURISHMENT PROJECT ... - fsbpa
You also want an ePaper? Increase the reach of your titles
YUMPU automatically turns print PDFs into web optimized ePapers that Google loves.
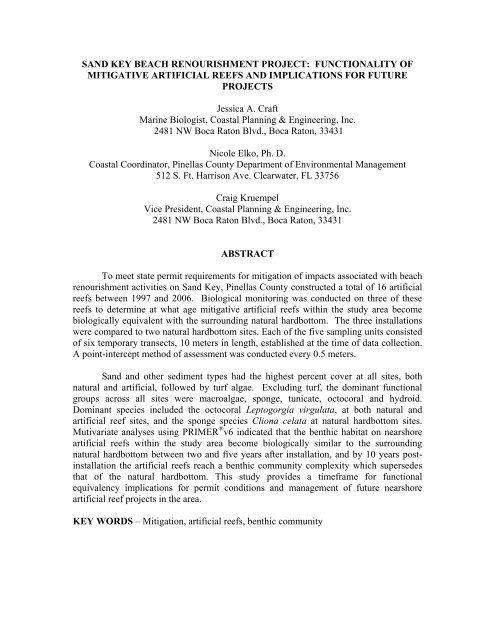
<strong>SAND</strong> <strong>KEY</strong> <strong>BEACH</strong> <strong>RENOURISHMENT</strong> <strong>PROJECT</strong>: FUNCTIONALITY OFMITIGATIVE ARTIFICIAL REEFS AND IMPLICATIONS FOR FUTURE<strong>PROJECT</strong>SJessica A. CraftMarine Biologist, Coastal Planning & Engineering, Inc.2481 NW Boca Raton Blvd., Boca Raton, 33431Nicole Elko, Ph. D.Coastal Coordinator, Pinellas County Department of Environmental Management512 S. Ft. Harrison Ave. Clearwater, FL 33756Craig KruempelVice President, Coastal Planning & Engineering, Inc.2481 NW Boca Raton Blvd., Boca Raton, 33431ABSTRACTTo meet state permit requirements for mitigation of impacts associated with beachrenourishment activities on Sand Key, Pinellas County constructed a total of 16 artificialreefs between 1997 and 2006. Biological monitoring was conducted on three of thesereefs to determine at what age mitigative artificial reefs within the study area becomebiologically equivalent with the surrounding natural hardbottom. The three installationswere compared to two natural hardbottom sites. Each of the five sampling units consistedof six temporary transects, 10 meters in length, established at the time of data collection.A point-intercept method of assessment was conducted every 0.5 meters.Sand and other sediment types had the highest percent cover at all sites, bothnatural and artificial, followed by turf algae. Excluding turf, the dominant functionalgroups across all sites were macroalgae, sponge, tunicate, octocoral and hydroid.Dominant species included the octocoral Leptogorgia virgulata, at both natural andartificial reef sites, and the sponge species Cliona celata at natural hardbottom sites.Mutivariate analyses using PRIMER ® v6 indicated that the benthic habitat on nearshoreartificial reefs within the study area become biologically similar to the surroundingnatural hardbottom between two and five years after installation, and by 10 years postinstallationthe artificial reefs reach a benthic community complexity which supersedesthat of the natural hardbottom. This study provides a timeframe for functionalequivalency implications for permit conditions and management of future nearshoreartificial reef projects in the area.<strong>KEY</strong> WORDS – Mitigation, artificial reefs, benthic community
INTRODUCTIONWith increasing coastal development and impacts to nearshore benthic resources,artificial reefs are becoming widely used as a means of mitigating these impacts.Although Florida waters support over half of the nation’s artificial reefs (Seaman, 2004;Bortone and Van Orman, 1985) there is still a need for accurate data in order to makedecisions regarding construction materials, optimal siting and functionality of theinstallations (Seaman, 2004; Baynes and Szmant, 1989; Heukel et al., 1989; Bohnsackand Sutherland, 1985). Increasing demands are being placed on artificial reef programsto satisfactorily prove that the installations are performing as expected (FDNR, 1992);that is, they must reach functional equivalency with the natural reef environment beingreplaced, often within a designated amount of time.The greatest challenge in damage and/or mitigation assessments involvesdetermining how to best characterize the health and level of services provided by thedamaged site and then assessing the scale of damage. Further, one must determine therate of progression of natural recovery or succession of the mitigation site to conditionsthat would prevail had the damage or injury not occurred (Peterson, et al., 2003). Asrecovery rates are often dependent on environmental conditions and geographic location,specific data for ecosystem recovery and succession/colonization at mitigation sites fordifferent regions of coastal Florida are needed to accurately determine permit conditionsand mitigation requirements.Sand Key is located on the west-central coast of Florida in Pinellas County. Atotal of 16 artificial reefs were constructed between 1997 and 2006 in order to meet statepermit requirements for mitigation of impacts associated with beach renourishmentactivities (Figure 1). The reefs were constructed with concrete construction materials,such as culverts, telephone poles, etc. In order to determine if and at what age theartificial reefs off Sand Key successfully mitigate for loss of services provided by naturalhardbottom impacted by project activities, three artificial reefs were sampled andcompared to two natural hardbottom sites. It is the intent of this report to provide a rateat which nearshore mitigation sites reach similar functionality with adjacent naturalhardbottom areas, with management applications for future projects in the central Floridagulf coast region.
NR1NR2NATURAL REEF MONITORING SITEFigure 1. Project location map.
METHODSMitigative artificial reefs and natural hardbottom sites were chosen based onconstruction dates for the artificial reefs and proximity to potential impact sites.Nearshore Artificial Reefs (AR) 1, 5 and 13 were chosen in order to sample across aneven distribution of age. The installations were 2, 5 and 10 years old, respectively, at thetime of sampling. Areas with contiguous hardbottom of relatively high quality(determined qualitatively from reconnaissance dives) suitable for the sampling methodsdescribed here were chosen for the natural hardbottom monitoring sites: Natural Reef 1(NR1) and Natural Reef 2 (NR2) (Figure 1).Each of the five sampling units consisted of six temporary transects established atthe time of data collection. A baseline was first established in a north-south directionalong the eastern interface of natural hardbottom and sand or artificial reef boundaries.Beginning at the eastern sand/reef interface, each monitoring transect was extended to thewest, perpendicular to the baseline every three to five meters, depending on the size ofthe area being sampled. Each transect was 10 m in length and was sampled using a pointinterceptmethod of benthic data collection every 0.5 m, starting at 0.5 m and ending at10 m. The point-intercept method was chosen due to the poor visibility often experiencedin the study area. At each point, a marine biologist documented attached benthic flora andfauna contacting or under the right and left sides of the 0.5-m marks to the lowest taxonpossible, for a total of 60 points per transect. Typically, the only organisms identifiableto species were octocorals. Stony coral colonies were also identified to species whenthey were observed, although stony coral was rare at all sites. The height of any coralcolony encountered, either stony or octocoral, was then measured to the nearestcentimeter.Data were summarized and tabulated, and community differences betweenartificial and natural reef sampling units were compared using the Plymouth Routines inMultivariate Ecological Research (PRIMER ® v6) 2006 software.RESULTSArtificial vs. Natural Reef Site Functional GroupsA summary of monitoring results is provided in Table 1. Because only coralswere identified to species, functional groups were used to describe and compare overallbenthic communities. Sand, rubble/shell hash and sediment were most abundant acrossall sites, followed by turf algae. After turf algae, the most dominant biotic functionalgroups across all sites were macroalgae, tunicate, sponge, hydroid and octocoral, with theorder of abundance varying at each site.
Table 1. Summary of functional group raw abundance per sampling unit.FunctionalGroupAR1 AR5Total pointsAR13 NR1 NR2sand/shell/sed 162 158 208 126 156turf 151 86 61 152 109macroalgae 7 16 33 45 32tunicate 6 22 21 3 31sponge 0 21 5 22 27octocoral 18 29 29 8 2hydroid 12 26 0 1 0stony coral 4 0 2 0 1zooanthid 0 0 0 1 1bryozoan 0 0 0 0 1worm 0 1 1 2 0bivalve 0 1 0 0 0Community differences between artificial and natural reef sampling units werecompared using the Plymouth Routines in Multivariate Ecological Research 2006(PRIMER ® v6) software. Functional group abundance data were transformed usingfourth root transformation. Since NR1 and NR2 sampling units are essentially replicates,abundance data from these sites were averaged into a single sampling unit representingnatural hardbottom prior to analysis. A Bray-Curtis similarity matrix was used to create anon-metric multidimensional scaling (MDS) ordination plot (Figure 2).Transform: Fourth rootResemblance: S17 Bray Curtis similarity2D Stress: 0.18Sampling UnitAR1AR5AR13NRFigure 2. MDS plot illustrating similarity of transects between NR and AR samplingunits.On the MDS orientation plot, points that fall close together represent similarcommunities, whereas points that fall farther apart are less similar. The natural
hardbottom sampled (shown in red) is more similar to AR5 and AR13 than to AR1(Figure 2).A Similarity of Percent analysis (SIMPER) was used to identify thediscriminating taxa between NR and AR sampling units (Table 2). Taxa were listed indecreasing order by their average contribution to the total average dissimilarity (δ)between groups, with a cutoff at 90%. Analysis of Similarity (ANOSIM) was conductedpost-hoc (Table 3) to assess the significance of differences in community compositionbetween NR and AR sampling units. The null hypothesis was that there were nodifferences between sampled groups of transects.Table 2. Order of functional groups comprising 90% of each sampling unit based onaverage abundance calculated by SIMPER analysis.RankFunctional Group NR AR1 AR5 AR13sand/shell/sediment 1 1 1 1turf 2 2 2 2macroalgae 3 5 -- 4sponge 4 -- 6 --tunicate 5 -- 4 5hydroid -- 3 5 --octocoral -- 4 3 3Table 3. ANOSIM and SIMPER pairwise comparisons of NR and AR sampling units.Groups R P value SIMPER(Pairwise Tests) Statistic (α=0.05) δ(%)AR5, NR 0.406 0.002 23.08AR13, NR 0.402 0.009 25.75AR1, NR 0.757 0.002 34.12The Global R statistic for the data was 0.446. Since none of the computedpermutations were larger than Global R, the null hypothesis that there are no differencesbetween sampled groups of transects was rejected (p
community composition to AR13 (81%) and AR5 (80%). AR5 and AR13 are also moresimilar to each other than either reef is to AR1.Transform: Fourth rootResemblance: S17 Bray Curtis similarity2D Stress: 0Sampling UnitAR1AR5AR13NRSimilarity708081Figure 3. MDS plot illustrating similarity of AR and NR benthic communities.
Benthic SpeciesThe only organisms identified to species were stony corals and octocorals, with theexception of one common sponge species. Macroalgae were identified to genus. In thecase of corals, very few stony corals were found at any of the sampling units, and onlytwo species of octocorals were observed during these investigations. Table 4 lists theabundance of genera and/or species.Table 4. Abundance of genera/species within the functional groups octocoral, stony coral,macroalgae and sponge.AR1 AR5 AR13 NR1 NR2 Total PointsPercent ofFunctional GroupOCTOCORALLeptogorgia virgulata 18 28 25 8 2 81 94.2%Leptogorgoa hebes 0 1 4 0 0 5 5.8%Total Points 18 29 29 8 2 86STONY CORALOcculina diffusa 4 0 0 0 0 4 57.1%Phyllangia americana 0 0 2 0 0 2 28.6%Solenastrea bournoni 0 0 0 0 1 1 14.3%Total Points 4 0 2 0 1 7MACROALGAECodium 3 0 11 0 0 14 10.5%Dictyota 3 4 0 0 0 7 5.3%Hypnea 1 12 9 39 23 84 63.2%Dasya 0 0 7 0 0 7 5.3%Sargassum 0 0 3 0 0 3 2.3%Halymenia 0 0 3 0 0 3 2.3%Gracilaria 0 0 0 1 1 2 1.5%Ceramium 0 0 0 1 8 9 6.8%Spyridia 0 0 0 1 0 1 0.8%Caulerpa 0 0 0 1 0 1 0.8%Chondria 0 0 0 1 0 1 0.8%Laurencia 0 0 0 1 0 1 0.8%Total Points 7 16 33 45 32 133SPONGECliona cellata 0 0 0 9 18 27 36.0%Cinachyra sp. 0 0 0 1 0 1 1.3%unknown spp. 0 21 5 12 9 47 62.7%Total Points 0 21 5 22 27 75Of the two species of octocorals observed, L. virgulata was by far the more commonspecies, accounting for 94.2% of total octocoral abundance (Table 4). L. virgulata wasdocumented at every sampling unit. L. hebes accounted for only 5.8% of total octocoralabundance and occurred only at AR5 and AR13. Octocorals in general wereconsiderably more abundant on the artificial reefs than on the natural hardbottom (88.4%and 11.6%, respectively) (Photographs 1-2).
Photographs 1-2. Comparison of L. virgulata on artificial versus natural reef.Macroalgae abundance increased on the artificial reefs with increasing age of theinstallations, with AR13 supporting the highest abundance of macroalgae (9.2%). AR13was also closest to the natural reef sites in macroalgae abundance, which had an averageof 10.7% abundance; however, all 12 observed macroalgae genera occurred on thenatural hardbottom, and only six of the 12 observed genera occurred on the artificialreefs.Sponge abundance was higher on the natural reefs than on the artificial reefs (Tables 1and 4). Natural reefs accounted for 65.3% (n=2) of total sponge abundance, whileartificial reefs accounted for only 34.6% (n=3). No sponges were recorded along AR1transects. The only sponge identified to the species level was Cliona celata. All othersponges observed were placed into the unknown category with the exception of twospecimens of Cinchyrella sp. (Cinachyrella, as well as many other sponges, are onlyidentifiable to species through microscopic examination of spicules). C. celata was thedominant sponge on the natural reefs, accounting for over half (55.1%) of the spongeabundance there (Photograph 3). It is a large species of sponge and is one of thedominant species found on the natural hardbottom within the study area. C. celata wasnot recorded on any of the artificial reef transects although it was qualitatively observedon AR13.Photograph 3. Cliona celata growing on the natural hardbottom.
Artificial Reef Colonization and SuccessionAbundance data were used to compare individual functional groups across artificial reefsites to identify successional patterns with age of the installations. For example, Table 1shows hydroids are present on AR1 and AR5, but not on AR13, and only a single pointidentified hydroid on any of the natural reef transects. This may indicate hydroids arefouling organisms that become out-competed on older, more established reefs. This hasbeen found to occur with the white telesto Carijoa riisei on artificial reefs on the eastcoast of Florida (CPE, 2005). Tunicates appear to increase with increasing age of thereef, and then reach a maximum abundance after five years. Macroalgae appear toincrease almost linearly with increasing age of the reef.In general, a decreasing trend in turf algae is apparent with increasing age of the artificialreefs, most likely due to the increasing abundance over time of encrusting organisms,such as tunicates (Photographs 4 and 5). Most biotic groups, with the exception ofmacroalgae, which appear to increase almost linearly with time, appear to reach a plateauapproximately five years post-construction. Differences in biotic cover can be seen inPhotographs 6 through 8. AR1 is covered primarily in turf algae with some octocorals,while the older reefs (AR5 and AR13) are encrusted with tunicates, macroalgae, sponges,and dense octocoral growth.Photograph 4. Encrusting tunicates on AR13. Photograph 5. Encrusting growth on AR5.AR1 AR5 AR13Photographs 6-8. Comparing benthic growth between AR1, AR5, and AR13.Leptogorgia virgulata colony heights were also compared between reef units. AR13 hadthe highest average L. virgulata height as well as the tallest single colony of all sites(Table 5). The groups of heights were tested for significant differences between
sampling units using two-sample t-tests assuming unequal variances. The onlysignificant difference was found between AR1 and AR13 (p=0.047). This indicates thatthe natural hardbottom exhibits a range of L. virgulata heights typical of a naturalenvironment, but that colonies on artificial reefs can be grouped into size classes basedon length of time since placement of the artificial reef.Table 5. Leptogorgia virgulata heights across sampling units.AR1 AR5 AR13 NRAverage (cm) 21.1 26.2 30.5 16.3Max Ht (cm) 28 35 57 47St. Dev 6.0 9.0 15.2 18.6n 9 18 15 10DISCUSSIONTest results show that the natural hardbottom is more similar in benthic communitycomposition to AR5 (5 years old) and AR13 (10 years old) than to AR1, the youngest ofthe artificial reefs assessed (2 years old). This suggests that the nearshore artificial reefsinstalled within the study area reach habitat equivalency with nearby natural hardbottombetween two and five years post-installation.Results also indicate that AR5 and AR13 are more similar in their communitycomposition to each other than either reef is to AR1. In addition, the artificial reefs showtrends in biotic cover that indicate AR1 and AR5 are still in earlier successional stagescompared to AR13. Hydroids were identified along transects at both AR1 and AR5, butabsent from AR13. This may indicate hydroids are fouling organisms that become outcompetedon older, more established reefs, similar to the white telesto (Carijoa riisei) onartificial reefs on the east coast of Florida (CPE, 2005). Tunicate percent cover appearsto increase with increasing age of the reef, and then reach a maximum abundance afterfive years, while macroalgae appear to increase continually with increasing age of thereef.CONCLUSIONSand and other sediment types had the highest percent cover at all sites, both natural andartificial, followed by turf algae. Excluding turf, the dominant functional groups acrossall sites were macroalgae, sponge, tunicate, octocoral and hydroid. Dominant speciesincluded the octocoral Leptogorgia virgulata, at both natural and artificial reef sites, andthe sponge species Cliona celata at natural hardbottom sites.The overall benthic community cover and composition of the artificial reefs appear toreach functional equivalency with the natural hardbottom between two and five yearspost-construction, and by 10 years post-construction, the artificial reef installations reacha community complexity which exceeds that of the natural hardbottom. This timeframefor functional equivalency may provide a guideline for developing requirements andtimelines for compliance in future coastal development projects on the west-centralFlorida coast that require mitigation reef installations or for other artificial reef studies.
REFERENCESBanes, T.W. and A.M. Szmant, 1989. Effect of current on the sessile benthic communitystructure of an artificial reef. Bulletin of Marine Science, 44(2). Pp. 545-566.Bohnsack, J. A. and D. L. Sutherland. 1985. Artificial reef research: a review withrecommendations for future priorities. Bulletin of Marine Science, 37(1). Pp. 11-39.Bortone, S.A. and D. Van Orman. 1985. Data base formation and assessment if biotic andabiotic parameters associated with artificial reefs. Florida Sea Grant TechnicalPaper No. 35.Clarke, K.R. and Gorley, R.N., 2006. PRIMER-E® (v6): User Manual/Tutorial.PRIMER-E Ltd, Plymouth, UK.Coastal Planning & Engineering, January 2005. First Annual Biological Monitoringreport of the Mitigation Reefs, 12 Months Post-construction of the MitigationReefs, Broward County, FL (Prepared for Broward County). 46 pp.Florida Department of Natural Resources (FDNR), 1992. Florida Artificial ReefDevelopment Plan. Prepared by E.N. Myatt and D.O. Myatt for the FloridaDepartment of Natural Resources, Division of Marine Resources, Office ofFisheries Management and Assistance Services, September 1992.Hueckel, G.J., R.M Buckley, and B.L. Benson. 1989. Mitigating rocky habitat loss usingartificial reefs. Bulletin of Marine Science, 44(2). Pp. 913-922.Peterson, C.H., R.T. Kneib, and A. Manen. 2003. Scaling restoration actions in themarine environment to meet quantitative targets of enhanced ecosystem services.Marine Ecology Progress Series, 264. Pp 173-175.Seaman, W. 2004. Artificial reef monitoring in Florida coastal counties. Publication ofthe National Sea Grant College Program of National Oceanic and AtmosphericAdministration (NOAA) under NOAA Grant No. NA 16RG-2195.


