Lab manual - Civil & Environmental Engineering
Lab manual - Civil & Environmental Engineering
Lab manual - Civil & Environmental Engineering

Create successful ePaper yourself
Turn your PDF publications into a flip-book with our unique Google optimized e-Paper software.
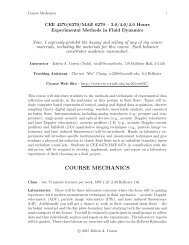
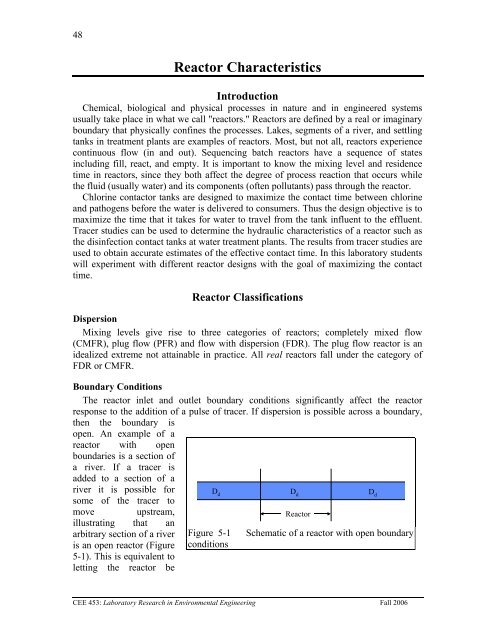
49defined as a section of along reactor. One of thecharacteristics of openboundaries is that some ofthe tracer introduced at thereactor inlet can be carriedReactorupstream and thus theD d entrance D dexitD d reactorresidence time for aconservative tracer can begreater than the hydraulic Figure 5-2 Schematic of a reactor with closedresidence time!boundary conditionsA "closed" reactor isone where the reactor hasa diffusion or dispersion coefficient different than those of the entrance or exit (FigureError! Reference source not found.). Typically exit and entrance diffusion/dispersionare much less than the diffusion/dispersion in the reactor. An example of a reactor withclosed boundaries is a tank with small inlet and outlet pipes.Reactor ModelingReactors can be studied by measuring the effluent concentration after the addition of aspike or pulse of a tracer in the influent or after a step function change in inputconcentration. The resulting response curves can be non dimensionalized by plottingC( t ) ∀ θ ras a function of t θ where θ is the hydraulic residence time. The term t θ willCtr∀trbe defined as t * . The non dimensional response curves from pulse inputs and step inputsare know as E curves and F curves respectively. The E curve is the exit age or residencetime distribution curve and the F curve represents the fraction of tracer molecules havingan exit age younger than t * . The E and F curves are related by*tF **=*( t ) ∫ E ( t )dt5.30The F *( t )curve can either be obtained by integrating E ( *t ) or by applying a stepfunction change in influent concentration to a reactor and monitoring the effluentconcentration. In that case F*is defined as( t )CF*= 5.4( t ) CinThe following sections will include typical E and F curves for different reactor types.Completely Mixed Flow ReactorComplete mix flow regimes can be approximated quite closely in practice. In the caseof CMF reactors, there is not an analytical solution to the advective dispersion equationReactor Characteristics
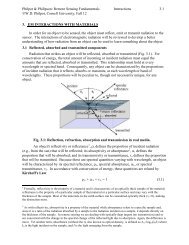
50so we revert to a simple mass balance. For a completely mixed reactor a mass balance ona conservative tracer yields the following differential equation:dC∀r= ( Cin− C)Q5.5dtwhere Q is the volumetric flow rate and ∀ris the volume of the reactor.Equation 5.5 can be used to predict a variety of effluent responses to tracer inputs suchas the pulse input used in this experiment. If a volume of tracer is discharged directly intoCtr∀tra reactor so that the initial concentration of tracer in the reactor is C0= and the∀input concentration is zero (C in= 0) the solution to the differential equation is:rE( t θ )C( t )∀θ r= =C ∀trtre⎛−t⎞⎜ ⎟⎝ θ ⎠or in the dimensionless formC ∀( t* r) ( tE*)*= =( t ) Ce −∀trtr5.65.7where E*is the exit age or( t )1.01residence time distribution0.80.8curve, ∀ris the reactor0.6E0.6volume, ∀tris the tracer EFF0.40.4volume, and C tris the tracert* at F=0.10.20.100.2concentration. If a reactor hasa complete mix flow regime its0.000.0 1.0 2.0 3.0response, E*, to a pulse input( t )t*should plot as a straight line ona semi-logarithmic plot. Figure 5-3 Exit age (E) and Cumulative exit ageResponse curves for a CMFR (F) curves for completely mixed flow reactors.are shown in Figure 5-3)The time for 10% of the pulse to arrive at the effluent of a CMFR is approximately0.1 t * .Plug Flow ReactorPlug flow regimes are impossible to attain because mass transport must be byadvection alone. There can be no differential displacement of tracer relative to theaverage advective velocity. In practice some mixing will occur due to moleculardiffusion, turbulent dispersion, and/or fluid shear. For the case of the plug flow reactorthe advective dispersion equation 5.11 reduces to:CEE 453: <strong>Lab</strong>oratory Research in <strong>Environmental</strong> <strong>Engineering</strong> Fall 2006
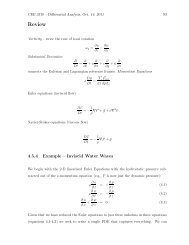
51∂C∂C=−U∂t∂xThe velocity, U, serves totransform the directionalconcentration gradient into atemporal concentration gradient. InCother words, a conservativeCsubstance moves with the advective oflow of the fluid. The solutions tothis differential equation for a pulseinput and for a step input are showngraphically in Figure 5-4. The timefor 10% of the pulse to arrive at theeffluent of a PFR is t * since all of Figure 5-4the pulse arrives at the same time. flow reactor.Flow with DispersionReal flow reactors that aren’t completely mixed exhibit behavior that is between plugflow and completely mixed. The reactor flow behavior is a function of the relativestrength of the mixing process (or dispersion) compared to the advective flow. Analyticalsolutions that describe these real reactors are more difficult and in most cases a parameterdescribing the dispersion is fit to the data rather than predicted a priori. Two models forarbitrary mixing levels are described below.Open Boundary conditions: One Dimensional Advective Dispersive EquationThe governing differential equation for a conservative (i.e., non-reactive) substance ina reactor that has advective transport (i.e., flow) and some mixing (dispersion) in thedirection of flow (x - dimension) is given in equation 5.11.∂ ∂ ∂= -U + D d 2∂t ∂x ∂x2C C Cpulse inputC = concentration of a conservative substanceU = average fluid velocity in the x directionD d= longitudinal dispersion coefficientt = timeThe dispersion is described by a single parameter that is the same in the reactor as it isat the inlet and outlet for open boundary conditions. The solution to equation 5.11 for thecase of complete mixing in y-z plane and advective and dispersive transport only in the xdirection for any x and t (after t=0) gives:2M ⎡ −x′⎤C(x,t) = exp ⎢ ⎥5.12A 4πD Dtdt⎣4d ⎦where M = mass of conservative material in the spike, D d= axial dispersion coefficient[L 2 /T], x' = x - Ut, U = longitudinal advective velocity in the reactor, and A is thecross-sectional area of the reactor. A measure of dispersion can be obtained directly fromUXC oCstep input5.9Pulse and step input in a plugU5.11XReactor Characteristics
52equation 5.12. From this equation we expect a maximum value of C at t = x/U. At thisMtime C(x,t) =. If the mass of the tracer input (M) and reactor cross-sectionalA 4πDdtarea (A) are known, then D dcan be estimated. Equation 5.12 can be made dimensionlessto more clearly reveal the important parameters. The dispersion coefficient can be madedimensionless by dividing by a velocity and a length.ULPe = 5.13Ddwhere L is the length of the reactor and U is the mean advective velocity. Thedimensionless parameter Pe (Peclet number) is used to characterize the level ofdispersion in a reactor. The Peclet number is the ratio of advective to dispersive transport.In the limiting cases when Pe = 0 (very high dispersion) we have a complete mix regime(CMFR) and when Pe = ∞ (D d= 0, no dispersion) we have a plug flow reactor (PF).The time can be normalized by dividing by the hydraulic residence time.* tUt = 5.14L* 2Combining Equations 5.13 and 5.14 we obtain Dtd= tPeL for substitution into Equation5.12. The concentration can be normalized by the mass of the tracer and the volume, ∀ ,of the reactor.∀ = AL5.15C(x,t) ∀E*= 5.16( t ) MThe position in the reactor where the concentration measurements are made can bechanged to the reactor effluent by substituting L for x. Substituting Equation 5.14 into the2definition of x′ we obtain:2( ) ( 1 ) 22 * 2′ = − = − 5.17x L Ut t LThe resulting dimensionless form of Equation 5.12 is given in Equation 5.18.E*=( t )*( 1−t)⎡Pe −exp ⎢4πt ⎢ 4t⎣* *2Pe⎤⎥⎥⎦5.18CEE 453: <strong>Lab</strong>oratory Research in <strong>Environmental</strong> <strong>Engineering</strong> Fall 2006
53Response curves for theadvective dispersion equation areshown in Figures 5-5 and 5-6. Theexit age curve is highly skewed forlow Pe because tracer that is in thereactor longer has more time fordispersion. As the Peclet numberincreases the dispersion decreasesand the response becomes closer toplug flow.Flow through porous media(such as groundwater through soil)is a type of flow with dispersion.The above equations can be appliedby recognizing that the relevantwater velocity is the pore watervelocity. The pore water velocity isQU = where A is the crossAεsectional area of the porous mediaand ε (volume of voids/totalvolume) is the porosity of theporous media.The form of equation 5.21 isexactly like the normal distributioncurve:3.012.50.82.0E0.6E 1.5FF1.0t* at F=0.1 0.40.50.840.20.000.0 1.0 2.0 3.0t*Figure 5-5 Exit age (E) and cumulativeexit age (F) curves for the advectivedispersion equation with Pe of 100.0.710.60.80.5E0.4F0.6EF0.3t* at F=0.10.40.20.10.530.20.000.0 1.0 2.0 3.0t*Figure 5-6 Exit age (E) and cumulativeexit age (F) curves for the advectivedispersion equation with Pe of 4.where2CA 1 ⎡ −x⎤= exp ⎢ 2 ⎥M σ 2π⎣4σx ⎦x5.21Or in dimensionless form:σ = 2Dt5.222xdσ 2x = *2tPe5.232L2The variance in concentration over space ( σx) is the variance in concentrations takenfrom many different positions in the reactor at some single moment in time, t. Thevariance in x ( σ ) has dimensions of length squared.2xClosed Boundary Conditions: Completely Mixed Flow Reactor in SeriesCompletely mixed flow reactors are sometimes connected in series to create a reactorsystem with flow characteristics in between CMFR and PFR. CMFRs in series increaseReactor Characteristics
54overall process efficiency because the reactants are at higher concentrations in the firstreactors than they would be in a single large CMFR. Thus the total reactor volume can besmaller with a series of CMFRs. Similarly the reaction process can be made moreefficient given the same reactor volume it if is divided into series CMFRs.Non ideal reactors with mixing levels between that of CMFRs and PFRs and reactorscontaining baffles can also be modeled as a series of CMFRs. In this case the mixinglevel for the system is represented by the number of CMFRs that are used to represent thenon-ideal reactor. The equation describing the concentration of a conservative tracer inthe N th reactor is given in equation 5.24.()⎛ ⎞N⎜CNt N tM ( N 1! )e θ ⎟∀ ⎝ ⎠⎛ ⎞= ⎜ ⎟− ⎝θ⎠The non-dimensional form of equation 5.24 is given in equation 5.25N −1− NtN( ) ( ) ( ) *( NtN1 )*N −*t e −=EN tN −1!It can be shown that equations 5.18 and 5.25 converge for large N when5.245.25Pe = 2N5.26Equation 5.24 is limited to integral values of N. The model could be extended toinclude non integral values ofE0.80.70.60.50.40.30.20.10.00.2600.0 1.0 2.0 3.0t*EFt* at F=0.10.6F0.4Figure 5-7 Exit age (E) and cumulative exit age(F) curves for series CMFR with N of 2.N if the factorial functionwere replaced with theΓ function. Note that the Γfunction is not defined as anextension of the factorialfunction in Excel. Instead usethefunctionsEXP(GAMMALN(N)) tocalculate the Γ function.Response curves for theadvective dispersion equationare shown in Figure 5-7.Notice that the effluentconcentration begins to risemuch more quickly in seriesCMFRs than in the advectivedispersion model. This distinction between the two models lessens as the number ofreactors increases and the Pe increases.Reactor StudiesMeasuring Reactor CharacteristicsOne of the easiest methods to determine the mixing (dispersion) characteristics of areactor is to add a spike input of a conservative material and then monitor the10.80.2CEE 453: <strong>Lab</strong>oratory Research in <strong>Environmental</strong> <strong>Engineering</strong> Fall 2006
55concentration of the material in the reactor effluent. The variance of tracer concentrationversus time ( σ , with dimensions of time squared) can be measured by sampling at a2tsingle point in the reactor at many different times and can be computed using thefollowing equations.where∞∞2 2Ct ()( t− t) dt t ⋅ Ctdt ()∫σ = = − t2 0 02t∞∞∫C() t dt C()t dt∫∫0 05.28For discrete data points:t=∞∫0∞tC()t dt∫0Ctdt ()5.29andn2∑ti⋅Ci∆t2 i=02σt= − tn∑i=0C∆ti5.30t=n∑ii=0nt ⋅C∆t∑i=0iiC∆tInlet and outlet boundary conditions affect the response obtained from a reactor.Closed reactors have little dispersion across their inlet and outlet boundaries whereas"open" reactors can have significant dispersion across their inlet and outlet boundaries.Typically open systems have no physical boundaries in the direction of flow. An exampleof an open system would be a river segment. Closed systems have small inlets and outletsthat minimize dispersion across the inlet and outlet regions. An example of a closedsystem is a tank (or a lake) with a small inlet and outlet. The reactor used in the lab isclosed. The t in equation 5.31 is the measured average residence time for the tracer inthe reactor. For ideal closed reactors the measured residence time, t , is equal to thetheoretical hydraulic residence time (θ = reactor volume/flow rate). For open reactors tcan exceed the hydraulic residence time. If t is less than the hydraulic residence time itmay indicate that the reactor contains “dead volume” or “short circuiting” such that somevolume of the reactor is effectively unused.5.31Reactor Characteristics
56The above equations suggest that from the reactor response to a spike input we cancompute the dispersion coefficient for the reactor. We have two options for measuringreactor response:1) synoptic measurements: at a fixed time sampling many points along the axis of thereactor will yield a Gaussian curve of concentration vs. distance. In practice synopticmeasurements are difficult because it requires sampling devices that aretime-coordinated. By combining equations 5.22, 5.30, and 5.31 it is possible toestimate the dispersion coefficient from synoptic measurements.2) single point sampling: measure the concentration at a fixed position along the x axisof the reactor for many times. If the reactor length is fixed at L and measurements aremade at the effluent of the reactor (observe the concentration of a tracer at x = L as afunction of time) then x is no longer a variable and C(x,t) becomes C(t) only. Theresponse curve obtained through single point sampling is skewed. The curve “spread”changes during the sampling period and the response curve is skewed.Peclet Number EstimationFor single point sampling of the effluent response curve, skew increases as thedispersion level in the reactor increases. The degree of skew depends on the dispersioncoefficient, the velocity in the x-direction, and the length of the reactor. Peclet values inthe range 100
5722θPe = 5.35σ2tMass ConservationWhen a pulse of conservative tracer is added to a continuous flow reactor, all of thetracer is expected to leave the reactor eventually. The mass of a substance that has left thereactor is given in equation 5.36.nM = ∑ QC ∆t5.36out i ii=0where Q is the flow rate and M is the mass of any substance whose concentration is givenby C. If Q and ∆t are constant, then equation 5.36 can be rewritten asoutnM = Q∆∑ t C5.37i=0Equation 5.37 can be used to determine if all of the tracer was measured in the reactoreffluent. Alternately, mass conservation can be checked by plotting the F curve andchecking if the plot approaches 1. If some of the tracer is in the reactor at the end of theexperiment then the following equation can be used to test for mass closure.iMin = Mout +∆ Mstored5.38TracersA conservative tracer will be used to characterize each of the reactors. Typical tracersinclude salt and various dyes. For the experiment we will use hydrogen ions as theconservative tracer. Normally hydrogen ions would not be a good choice because they arereactive. In the laboratory we can circumvent that problem by using distilled water toeliminate potential reactants. The hydrogen ion concentration will be measured using apH probe. The hydrogen ions will be added as hydrochloric acid.A reasonable number of hydrogen ions to add can be calculated based on the followingconstraints. An excessively high concentration of hydrogen ions will cause low pH valuesthat may not be measured accurately. Low concentrations of hydrogen ions will not beconservative because some reactions will occur with carbonates that have dissolved in thedistilled water from the atmosphere. The concentration of total carbonates can beobtained by setting the ANC to zero and solving for pH, then solving for Ct. Theconcentration of bicarbonate, the only reactive species at low pH can be calculated basedon the Ct and the pH. The concentration of bicarbonate is approximately 2.2 µM indistilled water. To reduce the error caused by reaction with bicarbonate the targethydrogen ion concentration should be at least 100x the bicarbonate concentration. Giventhese constraints a first guess for a reasonable number of hydrogen ions is that thehydrogen ion concentration of a completely mixed reactor containing the requisite traceraddition should be equivalent to pH 3.66 (or 220 µMoles H + per liter of reactor).Addition constraints for the tracer are that if a highly concentrated tracer is used, thenthere will be a significant density difference between the tracer and the water in theReactor Characteristics
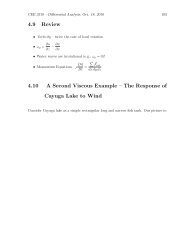
592Z ⎛ µ ⎞0.2µ2 ⎜−1 µ ⎟⎝ + ⎠γ = 105.44The activity coefficient correction isgenerally unnecessary for dilutesolutions. However, in this1laboratory we will use sodiumchloride for density matching and theconcentration of sodium chloridewill be high enough that the activityof the hydrogen ions will besignificantly decreased.0.950.90.850.80.750.7Acid Tracer DesignThe reactors are 30 cm long and15 cm wide. If the depth is limited to5 cm, then the total volume is 2.25 Land with the maximum pumping rate(380 mL/min) for our peristalticpumps the residence time is 6activity coefficient0.00001 0.001 0.1ionic strength (moles/L)Figure 5-9. Activity coefficient as a function ofionic strength for ionic species with a charge of+/- 1 based on the Davies relationship (equation5.44).minutes. Acid tracer can be added as 0.05 M HCl. If the reactor volume is 2.25 L with220 µeq/L of H + then 500 µeq of H + (or 10 mL 0.05 M HCl) are required.The tracer can be poured directly into the first chamber of your reactor or it can beinjected into the influent line. Red dye or methylene blue can also be added to the traceror used separately to qualitatively observe the turbulence levels of the jets.Mass balanceCollect data that makes it possible to perform a mass balance on hydrogen ions. Notethat if it is expedient to shorten an experimental run such that there is a significantquantity of the tracer residual in the reactor, that the residual (stored) tracer can bemeasured by pouring the reactor contents into a container and measuring the pH of theresultant mixture.Reactor DesignBaffle DesignBaffles can be added to tanks to decrease the ability of the solution to travel quicklyfrom the tank inlet to the tank outlet. The goal of the baffle design depends on whetherthe tank is designed for a reaction or for separation. The baffles in reactors shouldgenerally be designed to achieve mixing in each of the baffled zones. The baffles in tanksdesigned for separation (clarifiers) should be designed to achieve uniform flow (a muchmore difficult goal to achieve). Mixing within each baffled zone could be achieved with apropeller mixer or by appropriately sized ports in the baffles. If port mixing is desired theenergy for mixing is provided by the kinetic energy of the fluid flowing through the ports.Reactor Characteristics
60The flow characteristics of a baffled tank are complex and would requirecomputational fluid dynamics to model. In lieu of developing a CFD model we will turnto dimensional analysis to help us characterize the mixing efficiency of a baffled reactorsegment. The independent parameter that we will measure to characterize the reactor isits Peclet number.The design goal is to determine the diameter and spacing of the ports required toachieve adequate mixing. The fluid flow out of the ports is jet flow. The jets entrain andmix with the surrounding fluid. To develop effective mixing the jet should be turbulent.The transition between turbulent and laminar behavior for jets occurs at a jet Reynoldsnumber of a few hundred 2 .ReV dνjet jetjet= orRejet= 4Qjetπ d νor Rejetjet= 4Qreactorn π d ν5.46The optimal port spacing for maximum mixing could be based on the spread of the jet inthe distance to the next baffle. Jets expand in the radial direction at a rate ofapproximately 10% of the distance the jet travels axially. Thus the port spacing could bein a rectangular grid with the distance between ports equal to 10% of the distancebetween baffles. This spacing may be smaller than practical since it will require a largenumber of ports.An additional constraint on port design is that the head loss through the ports not beexcessive. The hydraulic grade line (and thus depth of each baffled reactor) will drop by adistance equal to the head loss through the ports. The head loss through the ports is givenby the orifice equationQ = K A 2g∆ h5.47orifice orifice orificewhere the orifice coefficient, Korifice, has a value of approximately 0.6, the area of theorifice is Aorifice, and the head loss through the orifice is ∆ h .2π dorificeQorifice= Korifice2g∆ h5.4842π dorificeQreactor = norificeKorifice2g∆ h5.494where norificeis the number of ports. Solving for the port diameter we obtain.portsjetdorifice=4Qreactorπ n K 2g∆horificeorifice5.502 Personal communication with Dr. Cowen.CEE 453: <strong>Lab</strong>oratory Research in <strong>Environmental</strong> <strong>Engineering</strong> Fall 2006
61Chlorine Contact Tank DesignThe design objective for chlorine contact tanks is to maximize the inactivation ofpathogens by maximizing the contact time between the chlorine and the pathogens beforethe water is sent to the distribution system. This objective has been codified with thecontact time for a tank defined as the time for the effluent of the tank to reach 10% of theinfluent value after a step change in the influent.Table 5-1. Comparison of t * at F = 0.1 for non-ideal reactors (Malcolm Pirnie, 1991)Baffling Guidance <strong>manual</strong> Extent of BafflesCondition value of*t at F = 0.1Unbaffled 0.1 No baffles, agitated basin with low length to width(CMFR)ratio, high inlet and outlet flow velocitiesPoorly baffled 0.3 Single or multiple unbaffled inlets and outlets, nointrabasin bafflesAverage 0.5 Baffled inlet or outlet with some intrabasin bafflesSuperior 0.7 Perforated inlet baffles, serpentine or perforatedintrabasin baffles, outlet weir or perforated laundersPerfect (PFR) 1.0 Very high length to width ratio (pipeline flow),perforated inlet, outlet and intrabasin bafflesThe reactor youwill be working withcan be easilymodified by installingvarious configurationsof perforated baffles(Figure 5-10). Yourobjectives are• to modifythe reactorProceduresFigure 5-10 Perforated baffle designs. The hole patterns aredesigned to create different levels of mixing and to createserpentine flow paths.to obtain amaximumvalue of t * at F = 0.1• to document your progress toward this goal by obtaining appropriateexperimental data• to compare your experimental data with appropriate modelsNote that you are allowed to collaborate with other teams to obtain the results fromadditional tests. All data sharing must be documented in your report.Baffle installationThe baffles can be installed by rolling a 3 mm diameter roll of putty and applying theputty to the bottom and one side of the baffle. Carefully install the baffle by rotating itReactor Characteristics
62into place (so the putty on the one side doesn’t have to slide) and then pressing it down(so the putty on the bottom doesn’t have to slide). Install the two bolts with wing nuts tohold the baffle in place. Add a roll of putty to the corner formed at the unsealed side ofthe baffle and press the putty into place.Testing protocolTo establish the steady-state hydraulic profile of your reactor it will be necessary tooperate at normal flow for a minute or more prior to injecting the tracer. The reactorvolume can be adjusted by changing the reactor effluent weir height. Data collection canbe by the pH meter software or by the Process Controller. The flow rate can also bevaried. When choosing flow rates, consider that it will be necessary to run tests forseveral hydraulic residence times. As part of your experimental protocol ensure you haveall of the necessary data for analysis including flow rates, tracer volumes, tracerconcentration, reactor volumes, and tracer injection times.)To ensure that everything is working properly I recommend that you begin by firsttesting a CMFR. Use the CMFR data to verify that you obtain mass balance and that youobtain the expected exit age response.For each test make sure that you accurately measure the reactor volume, residualreactor pH, and the flow rate. The reactor volume should be measured by pouring thereactor contents into another container and then using the 5k electronic balance todetermine the volume of water. Measure the residual concentration of hydrogen ions inthe reactor by measuring the pH of the container contents. The flow rate can beaccurately measured by massing an accurately timed sample from the pump (not from thereactor effluent).The pH probes are extremely sensitive to voltage fluctuations. The peristaltic pumpsproduce small amounts of static electricity as the rollers squeeze over the pump tubing.The result is a small change in voltage level of the solution in the reactor. This voltagefluctuation will be picked up by the pH probe and cause poor quality data. To eliminatethis problem a small grounding rod should be installed in the reactor and connected to anelectrical ground. The stirrer housing is grounded and thus any metal that is directlyconnected to the stirrer housing is grounded. An alternate way to ground the reactorsolution is to have the water flow through a short section of grounded metal tubing.Prelab Questions1) Calculate the concentration of bicarbonates in distilled water in equilibrium with theatmosphere. (This is similar to the Gran Plot prelab requiring the use of Solver.)2) Calculate the change in hydraulic grade line between baffled sections of a reactorwith a flow rate of 300 mL/min. The reactor baffles are perforated with 24 holes 1mm in diameter.3) Calculate the concentration of hydrogen ions in the reactor effluent given thefollowing situation. You added enough NaCl to the distilled water flowing throughthe reactor to match the density of 0.05 N HCl. You measured the pH in the reactoreffluent to be 4.0. (Hint: the activity of the hydrogen ions is less than 1.)CEE 453: <strong>Lab</strong>oratory Research in <strong>Environmental</strong> <strong>Engineering</strong> Fall 2006
63Data AnalysisUse a consistent set of units throughout your data analysis and include the units in yourspreadsheet and report!1) Convert the pH measurements into proton concentration including the correction foractivity.C*∀( t r)2) Create the data E curve from E (*= .t ) Mtr3) Create model E curves for CMFR in series and for the one dimensional advectivedispersion equation.4) Use multivariable nonlinear regression to obtain the best fit between the model Ecurves and the data E curve by using Solver to minimize the sum of the squarederrors. Allow Solver to vary the values of θ, Mtr, and either N or Pe (depending onthe model).5) Compare Mtrobtained using Solver with the actualdifferences.Mtradded and comment on any6) Compare θ obtained using Solver with the measured value of θ and comment on anydifferences.7) Plot data and model E curves and if appropriate show both model E curves andexplain which model fits best and compare with your expectations.8) Evaluate whether there is any evidence of “dead volumes” or “short circuiting” inyour reactor.9) Make a recommendation for the design of a full scale chlorine contact tank. As part ofyour recommendation discuss the following:• Serpentine flow paths versus perforated baffled reactors.• Effects of scaling up to full size based on dimensional analysis.• Effects of Reynolds scale effects on modeling baffled and serpentine flow.• Cumulative head loss through the contact tank.ReferencesWeber, W. J. J. and F. A. Digiano. 1996. Process Dynamics in <strong>Environmental</strong> Systems.New York, John Wiley & Sons, Inc.Malcolm Pirnie, Inc., and HDR <strong>Engineering</strong>, Inc. “Guidance Manual for Compliancewith the Filtration and Disinfection Requirements for Public Water Systems UsingSurface Water Sources.” AWWA, Denver CO, 1991.Reactor Characteristics
64Table 5-2.Equipment listDescription Supplier Catalognumberreactor with CEE shopbafflesvariable flow Cole Parmer H-07523-30digital driveEasy-Load Cole Parmer H-07518-00pump headPharMed tubing Cole Parmer H-06485-18size 1820 liter HDPEJerricanFisher Scientific 02-961-50CTable 5-3.Reagent list<strong>Lab</strong> Prep NotesDescription Supplier/Source CatalognumberAcid tracer 0.5 N HClred dye #40 MG Newell 07704-11) Use # 18 tubing for baffled tank.2) Organize team research so they don’t use the same materials and so they answerdifferent questions.CEE 453: <strong>Lab</strong>oratory Research in <strong>Environmental</strong> <strong>Engineering</strong> Fall 2006