PS07: Radar et al.
PS07: Radar et al.
PS07: Radar et al.

Create successful ePaper yourself
Turn your PDF publications into a flip-book with our unique Google optimized e-Paper software.
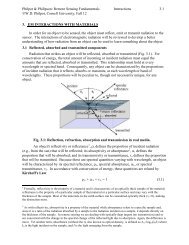
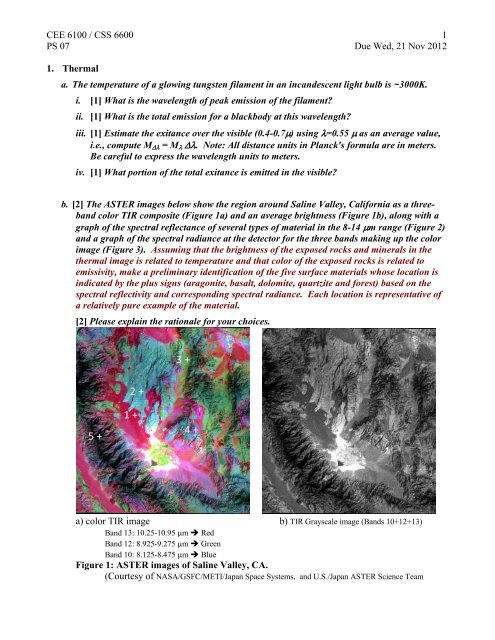
CEE 6100 / CSS 6600 1PS 07 Due Wed, 21 Nov 20121. Therm<strong>al</strong>a. The temperature of a glowing tungsten filament in an incandescent light bulb is ~3000K.i. [1] What is the wavelength of peak emission of the filament?ii. [1] What is the tot<strong>al</strong> emission for a blackbody at this wavelength?iii. [1] Estimate the exitance over the visible (0.4-0.7) using =0.55 as an average v<strong>al</strong>ue,i.e., compute M = M . Note: All distance units in Planck's formula are in m<strong>et</strong>ers.Be careful to express the wavelength units to m<strong>et</strong>ers.iv. [1] What portion of the tot<strong>al</strong> exitance is emitted in the visible?b. [2] The ASTER images below show the region around S<strong>al</strong>ine V<strong>al</strong>ley, C<strong>al</strong>ifornia as a threebandcolor TIR composite (Figure 1a) and an average brightness (Figure 1b), <strong>al</strong>ong with agraph of the spectr<strong>al</strong> reflectance of sever<strong>al</strong> types of materi<strong>al</strong> in the 8-14 m range (Figure 2)and a graph of the spectr<strong>al</strong> radiance at the d<strong>et</strong>ector for the three bands making up the colorimage (Figure 3). Assuming that the brightness of the exposed rocks and miner<strong>al</strong>s in th<strong>et</strong>herm<strong>al</strong> image is related to temperature and that color of the exposed rocks is related toemissivity, make a preliminary identification of the five surface materi<strong>al</strong>s whose location isindicated by the plus signs (aragonite, bas<strong>al</strong>t, dolomite, quartzite and forest) based on thespectr<strong>al</strong> reflectivity and corresponding spectr<strong>al</strong> radiance. Each location is representative ofa relatively pure example of the materi<strong>al</strong>.[2] Please explain the ration<strong>al</strong>e for your choices.3 +2 +5 +1 +4 +a) color TIR image b) TIR Graysc<strong>al</strong>e image (Bands 10+12+13)Band 13: 10.25-10.95 m RedBand 12: 8.925-9.275 m GreenBand 10: 8.125-8.475 m BlueFigure 1: ASTER images of S<strong>al</strong>ine V<strong>al</strong>ley, CA.(Courtesy of NASA/GSFC/METI/Japan Space Systems, and U.S./Japan ASTER Science Team
CEE 6100 / CSS 6600 2PS 07 Due Wed, 21 Nov 2012% Reflectance (Qurtzite)706050403020100Band10(blue)AragoniteBand12(grn)Bas<strong>al</strong>tQuartziteTreesDolomiteBand 13(Red)8 9 10 11 12wavelength (microns)Figure 2: TIR Reflectance spectra of selected materi<strong>al</strong>s.121086420% Reflectance(Bas<strong>al</strong>t, Aragonite,Dolomite & Trees)Figure 3: Sc<strong>al</strong>ed radiance at the d<strong>et</strong>ector (proportion<strong>al</strong> to the apparent temperature).TIR imageColor1 Red2 Green3 Cyan4 Purple5 Black ridgeLand coverRation<strong>al</strong>e
CEE 6100 / CSS 6600 3PS 07 Due Wed, 21 Nov 20122. Scatterom<strong>et</strong>er[2]A simplified model of the radar backscattering coefficient of a sea surface is: o = A + B cos (2 )where is the angle b<strong>et</strong>ween the wind direction and the radar look azimuth, and A and B are:A = 0.8 v – 30B = 3.5 – 0.1 vwhere v is the wind speed in m/s. A scatterom<strong>et</strong>er observation measures o v<strong>al</strong>ues of -22.9 dB and-21.1 dB looking north and east respectively. Find the wind velocity. Is there any ambiguity inyour answer? If so, could it be removed by a third observation.You may need the trigonom<strong>et</strong>ric identities: cos 2 = cos 2 - sin 2 cos ( ± ) = cos cos ± sin sin cos (90-) = sin sin (90-) = - cos 3.<strong>Radar</strong> - Re<strong>al</strong> vs. Synth<strong>et</strong>ic aperturea. [2] The Seasat SAR was an L-band system (1.275 GHz) that flew at an <strong>al</strong>titude of ~800 km andprovided a nomin<strong>al</strong> 25 m (azimuth) x 25 m (range) resolution. Its antenna dimensions were10.74 m x 2.16 m and the depression angle was 70. What physic<strong>al</strong> aperture size would havebeen required for a re<strong>al</strong> aperture system with the same azimuth<strong>al</strong> resolution?b. [1] What would the equiv<strong>al</strong>ent re<strong>al</strong> aperture have been for the SIR-C, X-band radar, a 10 GHzradar flying at 225 km with a nomin<strong>al</strong> depression angle of 50 and a nomin<strong>al</strong> resolution of 30 mx 30 m. (The actu<strong>al</strong> size of the X-band antenna was 12.0 x 0.4 m<strong>et</strong>ers).c. [1] Fin<strong>al</strong>ly, what would the azimuth<strong>al</strong> resolution be for an aircraft flying the SIR-C system as are<strong>al</strong> aperture radar at an <strong>al</strong>titude of 20 km.4. <strong>Radar</strong>: roughnessa. [2] D<strong>et</strong>ermine roughness categories for a radar system using the following wavelengths at adepression angle γ of 30 degrees and compl<strong>et</strong>e the table below.Roughness Category Ka Band (0.86 cm) X Band (3.0 cm) L Band (25.0 cm)SmoothRoughb. [1] A geologist needs to distinguish t<strong>al</strong>us (h = 12.0 cm) from gravel deposits ( h = 1.5 cm ).According to the above table, what wavelength radar image would be most effective formaking this distinction?
CEE 6100 / CSS 6600 4PS 07 Due Wed, 21 Nov 20125. The image below shows the North shore of Lake Superior, July 1991, imaged by <strong>Radar</strong>sat in wideswath mode.a. [2] From what direction is the incoming radar illumination coming? Give at least 2 d<strong>et</strong>ailsto justify your choice.b. [3] There are sever<strong>al</strong> linear features in the image, three of which are indicated by arrows.One is a fault line, one is a road and one is a flaw in the processing (effectively a bad scanline). Specify which is which and justify your choices.