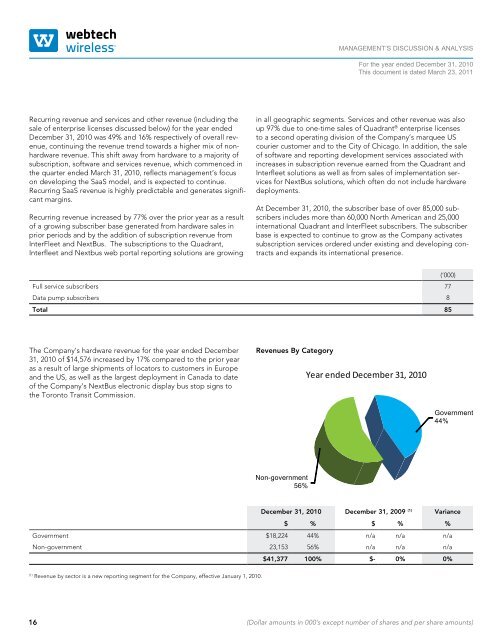
MANAGEMENT’S DISCUSSION & ANALYSISFor the year ended December 31, <strong>2010</strong>This document is dated March 23, 2011Recurring revenue and services and other revenue (including thesale of enterprise licenses discussed below) for the year endedDecember 31, <strong>2010</strong> was 49% and 16% respectively of overall revenue,continuing the revenue trend towards a higher mix of nonhardwarerevenue. This shift away from hardware to a majority ofsubscription, software and services revenue, which commenced inthe quarter ended March 31, <strong>2010</strong>, reflects management’s focuson developing the SaaS model, and is expected to continue.Recurring SaaS revenue is highly predictable and generates significantmargins.Recurring revenue increased by 77% over the prior year as a resultof a growing subscriber base generated from hardware sales inprior periods and by the addition of subscription revenue fromInterFleet and NextBus. The subscriptions to the Quadrant,Interfleet and Nextbus web portal reporting solutions are growingin all geographic segments. Services and other revenue was alsoup 97% due to one-time sales of Quadrant ® enterprise licensesto a second operating division of the Company’s marquee UScourier customer and to the City of Chicago. In addition, the saleof software and reporting development services associated withincreases in subscription revenue earned from the Quadrant andInterfleet solutions as well as from sales of implementation servicesfor NextBus solutions, which often do not include hardwaredeployments.At December 31, <strong>2010</strong>, the subscriber base of over 85,000 subscribersincludes more than 60,000 North American and 25,000international Quadrant and InterFleet subscribers. The subscriberbase is expected to continue to grow as the Company activatessubscription services ordered under existing and developing contractsand expands its international presence.(‘000)Full service subscribers 77Data pump subscribers 8Total 85The Company’s hardware revenue for the year ended December31, <strong>2010</strong> of $14,576 increased by 17% compared to the prior yearas a result of large shipments of locators to customers in Europeand the US, as well as the largest deployment in Canada to dateof the Company’s NextBus electronic display bus stop signs tothe Toronto Transit Commission.Revenues By CategoryDecember 31, <strong>2010</strong> December 31, 2009 (1) Variance$ % $ % %Government $18,224 44% n/a n/a n/aNon-government 23,153 56% n/a n/a n/a$41,377 100% $- 0% 0%(1)Revenue by sector is a new reporting segment for the Company, effective January 1, <strong>2010</strong>.16 (Dollar amounts in 000’s except number of shares and per share amounts)
MANAGEMENT’S DISCUSSION & ANALYSISFor the year ended December 31, <strong>2010</strong>This document is dated March 23, 2011In the year ended December 31, <strong>2010</strong> the Company derived$23,153 of its revenue from the non-government sector in its OEM,insurance and fleet services verticals primarily through subscriptionrevenues and shipments of locators to customers in Europeand the US. Sales to customers in the government sector, totaling$18,224, were driven by subscription revenues and sales of servicesassociated with the sale of Quadrant Enterprise License to the Cityof Chicago and sales of the Company’s NextBus predictive arrivalsystem and InterFleet solutions. Sales to the government sectorare generally stable, predictable as upon successful completionof the sales cycle government customers tend to engage in longterm relationships with the Company.The Company expects to achieve continued growth in the governmentsector in the coming years as a portion of its sales force isdedicated to this market segment and is building an awarenessof the InterFleet brand as a solution for public sector service functionand fleet managers. The Interfleet brand encompasses functionspecific solutions for operators of snow plows, salt spreaders,waste management vehicles, emergency medical services (“EMS”),police vehicles and other government functions. The Companyintends to continue to develop and add to these solutions andexpand its customer base through both direct and indirect salesefforts. In the short term, the warranty issues with the Interfleetproduct previously discussed may have an impact on governmentsales. The Company has taken a number of proactive steps toresolve these issues and avoid any impact on sales.The Company also expects to see continued growth in the nongovernmentsector driven by increasing regulation in the transportationsector (Hours of Service, and related driver reporting), theadoption of telematics to improve efficiencies and the beginningof adoption of telematics solutions by insurance companies servingindividual drivers and fleet owners.Gross Profit and Gross Profit MarginsIn the year ended December 31, <strong>2010</strong>, gross profit increased 46%due to the sales of the Interfleet and Nextbus products and services.However, gross profit margin decreased two percentage pointsor 4% from 52% to 50%. In 2009, the gross margin percentagewas positively impacted by the one-time sale of a very large highmargin software license. In the current year, the Company took aone-time charge against cost of goods sold arising from its yearendreview of inventory as the book value of inventory held by theCompany at its Toronto manufacturing facility was overstated by$529. The Company also recorded an increase in it obsolescenceprovision related to the Toronto inventory totaling $287. In addition,there were significant sales of hardware products that arenearing the end of their product lifecycle at lower than typicalmargins in the fourth quarter. Lastly, the Company experiencedone-time technology issues with one of its Quadrant customersand a number of its Interfleet Inc. customers related to devicessold during the year, and as a result, has accrued an additionalwarranty expense totaling $510. Quadrant expense was $118 andInterfleet expense was $392. These events negatively impactedthe gross profit margin. The negative impacts were partially offsetby the previously mentioned one-time high margin sales ofQuadrant enterprise licenses, and the mix of high margin recurringservices revenues. Assuming sales prices and the product mixbetween hardware and non-hardware revenue remains consistent,the Company expects gross margins to remain above 50% in thefuture.Operating ExpensesOperating expenses which include large non-cash charges foramortization related to the Interfleet Inc. acquisition increased by30% over the prior year, primarily as a result of the acquisition ofInterfleet Inc. including the aforementioned amortization attributableto the intangible assets acquired, legal fees, and increasedspending on research and development efforts as the Companyconsolidates its three internet portals and develop replacementhardware products for products at the end of their product lifecycle.Excluding the impact of Interfleet Inc., operating expensesdecreased by 13% over the prior year. The decrease is largely dueto reduced salary costs as a result of headcount reductions relatedto restructuring reduced bad debt expense and litigation settlementcosts in 2009.Sales and MarketingIn the year ended December 31, <strong>2010</strong>, marketing and salesexpenses increased 17% over the prior comparable period, primarilyas a result of the addition of Interfleet Inc. marketing and salesexpense. Excluding the impact of Interfleet Inc., marketing andsales expenses decreased by 9% over the prior comparable periodas a result of reduced spending on travel, less spending on consultants,lower commissions on sales arising from a revised compensationplan and lower sales of hardware than the prior comparableperiod.Research and DevelopmentThe Company continues to invest in research and developmentactivities to maintain technical leadership in automotive and transportationmarkets. Research and development costs increased45% over the prior year through the addition of Interfleet Inc.expenses. Excluding the impact of Interfleet Inc., research anddevelopment spending declined 5% over the prior year as theCompany reduced its reliance on external consultants to completeresearch and development projects, but increased its staffing tosupport the enhancement of the Company’s product portfolio andservice offerings, and the integration of its three product lines.(Dollar amounts in 000’s except number of shares and per share amounts)17