Community-based Networks and Innovative Technologies: New ...
Community-based Networks and Innovative Technologies: New ...
Community-based Networks and Innovative Technologies: New ...

Create successful ePaper yourself
Turn your PDF publications into a flip-book with our unique Google optimized e-Paper software.
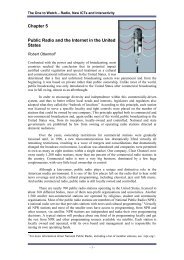
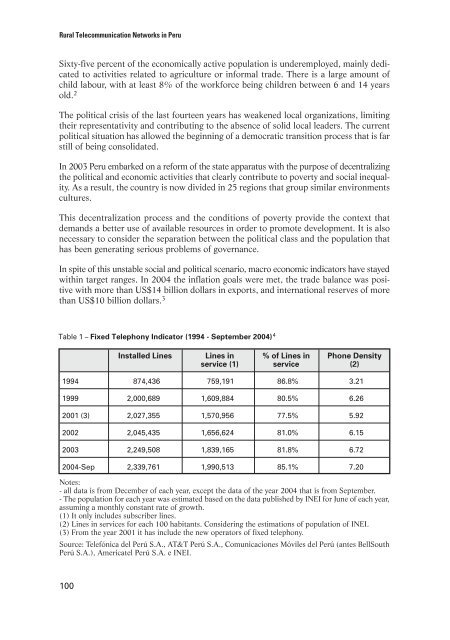
Rural Telecommunication <strong>Networks</strong> in PeruSixty-five percent of the economically active population is underemployed, mainly dedicatedto activities related to agriculture or informal trade. There is a large amount ofchild labour, with at least 8% of the workforce being children between 6 <strong>and</strong> 14 yearsold. 2The political crisis of the last fourteen years has weakened local organizations, limitingtheir representativity <strong>and</strong> contributing to the absence of solid local leaders. The currentpolitical situation has allowed the beginning of a democratic transition process that is farstill of being consolidated.In 2003 Peru embarked on a reform of the state apparatus with the purpose of decentralizingthe political <strong>and</strong> economic activities that clearly contribute to poverty <strong>and</strong> social inequality.As a result, the country is now divided in 25 regions that group similar environmentscultures.This decentralization process <strong>and</strong> the conditions of poverty provide the context thatdem<strong>and</strong>s a better use of available resources in order to promote development. It is alsonecessary to consider the separation between the political class <strong>and</strong> the population thathas been generating serious problems of governance.In spite of this unstable social <strong>and</strong> political scenario, macro economic indicators have stayedwithin target ranges. In 2004 the inflation goals were met, the trade balance was positivewith more than US$14 billion dollars in exports, <strong>and</strong> international reserves of morethan US$10 billion dollars. 3Table 1 – Fixed Telephony Indicator (1994 - September 2004) 4Installed Lines Lines in % of Lines in Phone Densityservice (1) service (2)1994 874,436 759,191 86.8% 3.211999 2,000,689 1,609,884 80.5% 6.262001 (3) 2,027,355 1,570,956 77.5% 5.922002 2,045,435 1,656,624 81.0% 6.152003 2,249,508 1,839,165 81.8% 6.722004-Sep 2,339,761 1,990,513 85.1% 7.20Notes:- all data is from December of each year, except the data of the year 2004 that is from September.- The population for each year was estimated <strong>based</strong> on the data published by INEI for June of each year,assuming a monthly constant rate of growth.(1) It only includes subscriber lines.(2) Lines in services for each 100 habitants. Considering the estimations of population of INEI.(3) From the year 2001 it has include the new operators of fixed telephony.Source: Telefónica del Perú S.A., AT&T Perú S.A., Comunicaciones Móviles del Perú (antes BellSouthPerú S.A.), Americatel Perú S.A. e INEI.100