

Analysis and comparison of bullet leads by inductively ... - Library
Analysis and comparison of bullet leads by inductively ... - Library
Analysis and comparison of bullet leads by inductively ... - Library

You also want an ePaper? Increase the reach of your titles
YUMPU automatically turns print PDFs into web optimized ePapers that Google loves.
high-concentration elements to dominate the <strong>comparison</strong>, <strong>and</strong> to<br />
give each element equal weight. The average for each column in<br />
Table 4 was subtracted from each individual value within the column,<br />
<strong>and</strong> the result was divided <strong>by</strong> the st<strong>and</strong>ard deviation for the<br />
column. The resulting numbers center around zero <strong>and</strong> range from<br />
several units negative to several units positive. Euclidean results<br />
are not affected <strong>by</strong> the sign <strong>of</strong> the data, <strong>and</strong> are always positive.<br />
Figure 2 shows histograms for correlation values for within-box<br />
<strong>and</strong> between-box (between-manufacturer) <strong>comparison</strong>s. Clustering<br />
at opposite ends for these two populations is expected, inasmuch as<br />
<strong>bullet</strong>s from the same box are expected to have similar compositions,<br />
<strong>and</strong> <strong>bullet</strong>s from different manufacturers are expected to be<br />
different. However, also evident is the fact that there are <strong>bullet</strong>s<br />
within a box that have very different elemental compositions, giving<br />
rise to correlations ranging from 95 down to less than 5. Correlation<br />
values for the between-box <strong>comparison</strong>s peak between zero<br />
<strong>and</strong> 5, <strong>and</strong> increase in rapidly diminishing numbers, with only two<br />
<strong>of</strong> the 1650 intermanufacturer <strong>comparison</strong>s (0.1%) exceeding 90.<br />
The median correlation for same-box <strong>comparison</strong>s is 85.9, whereas<br />
that for between-box <strong>comparison</strong>s is only 9.2.<br />
Figure 3 shows histograms for Euclidean distances for<br />
within-box <strong>and</strong> between-box <strong>comparison</strong>s. Here, the differences<br />
between the two populations are not as distinct. While the<br />
same-box <strong>comparison</strong>s cluster near zero as expected, the between-<br />
FIG. 4—Exp<strong>and</strong>ed-scale distributions for correlation values for withinbox<br />
<strong>comparison</strong>s (top) <strong>and</strong> between-manufacturer <strong>comparison</strong>s (bottom).<br />
KETO • BULLET LEADS 1025<br />
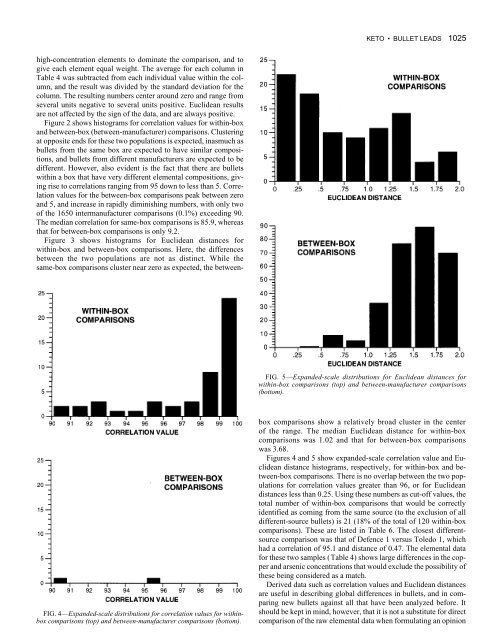
FIG. 5—Exp<strong>and</strong>ed-scale distributions for Euclidean distances for<br />
within-box <strong>comparison</strong>s (top) <strong>and</strong> between-manufacturer <strong>comparison</strong>s<br />
(bottom).<br />
box <strong>comparison</strong>s show a relatively broad cluster in the center<br />
<strong>of</strong> the range. The median Euclidean distance for within-box<br />
<strong>comparison</strong>s was 1.02 <strong>and</strong> that for between-box <strong>comparison</strong>s<br />
was 3.68.<br />
Figures 4 <strong>and</strong> 5 show exp<strong>and</strong>ed-scale correlation value <strong>and</strong> Euclidean<br />
distance histograms, respectively, for within-box <strong>and</strong> between-box<br />
<strong>comparison</strong>s. There is no overlap between the two populations<br />
for correlation values greater than 96, or for Euclidean<br />
distances less than 0.25. Using these numbers as cut-<strong>of</strong>f values, the<br />
total number <strong>of</strong> within-box <strong>comparison</strong>s that would be correctly<br />
identified as coming from the same source (to the exclusion <strong>of</strong> all<br />
different-source <strong>bullet</strong>s) is 21 (18% <strong>of</strong> the total <strong>of</strong> 120 within-box<br />
<strong>comparison</strong>s). These are listed in Table 6. The closest differentsource<br />
<strong>comparison</strong> was that <strong>of</strong> Defence 1 versus Toledo 1, which<br />
had a correlation <strong>of</strong> 95.1 <strong>and</strong> distance <strong>of</strong> 0.47. The elemental data<br />
for these two samples (Table 4) shows large differences in the copper<br />
<strong>and</strong> arsenic concentrations that would exclude the possibility <strong>of</strong><br />
these being considered as a match.<br />
Derived data such as correlation values <strong>and</strong> Euclidean distances<br />
are useful in describing global differences in <strong>bullet</strong>s, <strong>and</strong> in comparing<br />
new <strong>bullet</strong>s against all that have been analyzed before. It<br />
should be kept in mind, however, that it is not a substitute for direct<br />
<strong>comparison</strong> <strong>of</strong> the raw elemental data when formulating an opinion


