chapter v cropping pattern, crop diversification and value addition
chapter v cropping pattern, crop diversification and value addition
chapter v cropping pattern, crop diversification and value addition

You also want an ePaper? Increase the reach of your titles
YUMPU automatically turns print PDFs into web optimized ePapers that Google loves.
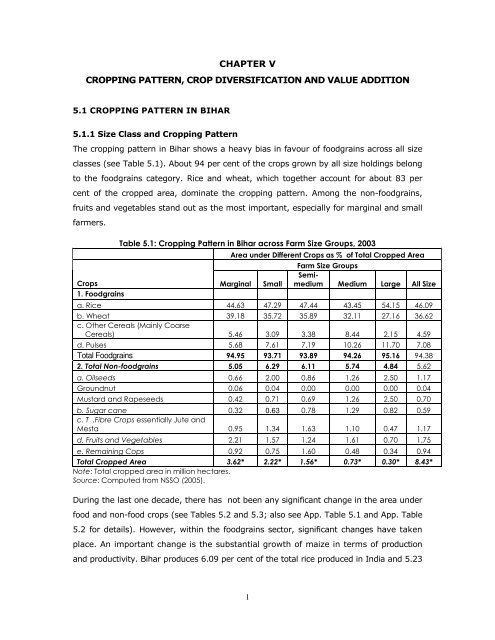
CHAPTER VCROPPING PATTERN, CROP DIVERSIFICATION AND VALUE ADDITION5.1 CROPPING PATTERN IN BIHAR5.1.1 Size Class <strong>and</strong> Cropping PatternThe <strong><strong>crop</strong>ping</strong> <strong>pattern</strong> in Bihar shows a heavy bias in favour of foodgrains across all sizeclasses (see Table 5.1). About 94 per cent of the <strong>crop</strong>s grown by all size holdings belongto the foodgrains category. Rice <strong>and</strong> wheat, which together account for about 83 percent of the <strong>crop</strong>ped area, dominate the <strong><strong>crop</strong>ping</strong> <strong>pattern</strong>. Among the non-foodgrains,fruits <strong>and</strong> vegetables st<strong>and</strong> out as the most important, especially for marginal <strong>and</strong> smallfarmers.Table 5.1: Cropping Pattern in Bihar across Farm Size Groups, 2003Crops Marginal Small1. FoodgrainsArea under Different Crops as % of Total Cropped AreaFarm Size GroupsSemimediumMedium Large All Sizea. Rice 44.63 47.29 47.44 43.45 54.15 46.09b. Wheat 39.18 35.72 35.89 32.11 27.16 36.62c. Other Cereals (Mainly CoarseCereals) 5.46 3.09 3.38 8.44 2.15 4.59d. Pulses 5.68 7.61 7.19 10.26 11.70 7.08Total Foodgrains 94.95 93.71 93.89 94.26 95.16 94.382. Total Non-foodgrains 5.05 6.29 6.11 5.74 4.84 5.62a. Oilseeds 0.66 2.00 0.86 1.26 2.50 1.17Groundnut 0.06 0.04 0.00 0.00 0.00 0.04Mustard <strong>and</strong> Rapeseeds 0.42 0.71 0.69 1.26 2.50 0.70b. Sugar cane 0.32 0.63 0.78 1.29 0.82 0.59c. T .Fibre Crops essentially Jute <strong>and</strong>Mesta 0.95 1.34 1.63 1.10 0.47 1.17d. Fruits <strong>and</strong> Vegetables 2.21 1.57 1.24 1.61 0.70 1.75e. Remaining Cops 0.92 0.75 1.60 0.48 0.34 0.94Total Cropped Area 3.62* 2.22* 1.56* 0.73* 0.30* 8.43*Note: Total <strong>crop</strong>ped area in million hectares.Source: Computed from NSSO (2005).During the last one decade, there has not been any significant change in the area underfood <strong>and</strong> non-food <strong>crop</strong>s (see Tables 5.2 <strong>and</strong> 5.3; also see App. Table 5.1 <strong>and</strong> App. Table5.2 for details). However, within the foodgrains sector, significant changes have takenplace. An important change is the substantial growth of maize in terms of production<strong>and</strong> productivity. Bihar produces 6.09 per cent of the total rice produced in India <strong>and</strong> 5.231
per cent of the total wheat. Its share in the country's maize production is 9.60 per cent,which is progressively increasing.Table 5.2: Cropping Pattern in Bihar Agriculture (1993-94 <strong>and</strong> 2006-07):Area, Production <strong>and</strong> Yield of Principal CropsParticulars Rice Wheat Maize Sugarcane1993-94Area 3321 2012 598 120Production 4749 4265 1113 4291Yield 1430 2120 1861 357582006-07Area 3571 2151 646 119Production 4409 5019 1515 4083Yield 1235 2333 2343 34353Note: Area: 000 hectares, Production: 000 tonnes, <strong>and</strong> Yield: Kg\ha.Source: CMIE (2007); Agriculture Statistics at a Glance, Government of India.Table 5.3: Percentage Change in Area, Production <strong>and</strong> Yield of Major Cropsin Bihar(1993-94 To 2006-07)Particulars Rice Wheat Maize SugarcaneArea 7.53 6.91 8.03 -0.83Production -7.16 17.68 36.12 -4.85Yield -13.64 10.05 25.90 -3.93Source: CMIE (2007) <strong>and</strong> Agriculture Statistics at a Glance, Government of India.The dominance of foodgrains, mainly rice <strong>and</strong> maize, is not a disadvantage per se. Themain argument in favour of moving towards a non-foodgrains economy in Bihar is thechanging <strong>pattern</strong> of the consumer dem<strong>and</strong>, with progressively smaller amounts being spenton foodgrains. However, the dem<strong>and</strong> for foodgrains is also expected to increase over aperiod of time, though at a slower pace, <strong>and</strong> Bihar needs to augment its foodgrainproduction in order to ensure its food security. According to the Working Group on CropProduction for the Eleventh Five Year Plan, India's dem<strong>and</strong> for foodgrains is likely toincrease by 2.3 per cent over the next five years. Besides, the prices for thesecommodities are hardening all over the world, including in India. Bihar can take advantageof this situation by improving its grain production. There is, however, scope for<strong>diversification</strong> in the <strong><strong>crop</strong>ping</strong> <strong>pattern</strong> at the margin towards non-foodgrains, particularly infavour of horticulture <strong>crop</strong>s, to augment the incomes of the cultivators.2
The emphasis on foodgrains has another positive implication for Bihar. As reportedearlier, a large proportion of its cultivated l<strong>and</strong> is concentrated in small <strong>and</strong> marginalholdings, <strong>and</strong> foodgrains occupy a significant portion of the l<strong>and</strong> under these holdings. Anemphasis on foodgrains will also help them meet their goal of food security. In <strong>addition</strong>,even the foodgrain <strong>crop</strong>s have ample scope for <strong>value</strong> <strong>addition</strong>. The use of maize used forproducing bio-fuel or starch <strong>and</strong> for other industrial uses is an excellent example ofthis.The scope for <strong>value</strong> <strong>addition</strong> by substituting more suitable <strong>crop</strong>s in different agro-climaticregions needs to be exploited. For example, upl<strong>and</strong> paddy can be replaced by arhar orurad. Wheat can be replaced by winter maize. With the extension of irrigation, currentfallow l<strong>and</strong> can be brought under pulses. The indicative targets for the proposed changes inthe <strong><strong>crop</strong>ping</strong> <strong>pattern</strong> in foodgrains, fruits <strong>and</strong> vegetables, along with their production, areprovided in Tables 5.5 to 5.7.Apart from the fact that dairying is already a widely practised enterprise <strong>diversification</strong>strategy (there is more on this in the next section), small patches of l<strong>and</strong> even on the smallholdings can be devoted to non-foodgrain <strong>crop</strong>s. This is what the farmers in several areasare doing to generate cash incomes. It is important to advise <strong>and</strong> help them selectappropriate non-foodgrain <strong>crop</strong>s. Crops which can contribute to <strong>value</strong> <strong>addition</strong> even on thesmall holdings are maize, horticulture <strong>crop</strong>s <strong>and</strong> vegetables.The main reason for adopting a cautious approach to large-scale <strong>crop</strong> <strong>diversification</strong> is therisk involved in the latter. Even for a limited extent of <strong>crop</strong> <strong>diversification</strong>, it is important tostrengthen marketing linkages as also to ensure easy access to <strong>and</strong> reasonable prices ofstaple foodgrains to the small <strong>and</strong> marginal farmers. There are numerous examples offarmers being pushed to grow some unfamiliar <strong>crop</strong> <strong>and</strong> then left to themselves to findmarkets. Similarly, with inadequate <strong>and</strong> unsatisfactory functioning of the PublicDistribution System (PDS) in foodgrains, the farmers may have to face double jeopardy ifthey ab<strong>and</strong>on foodgrains.5.2 STRATEGY FOR VALUE ADDITION ON SMALL FARMSA multi-pronged strategy for <strong>value</strong> <strong>addition</strong> on the farms, especially on small farms,needs to be adopted <strong>and</strong> the following sub-sections detail the important aspects ofthe proposed strategy.5.2.1 Filling-in Productivity Gaps in the Staple Crops3
The main thrust of policy should be to increase the productivity of the principal <strong>crop</strong>s ofBihar. Except for a few <strong>crop</strong>s such as maize <strong>and</strong> pulses, the yield per hectare of theprincipal <strong>crop</strong>s in Bihar is way below that which is achievable (see Table 5.4). Evencompared to yields in other important states producing the same <strong>crop</strong>s, the yields arelower in Bihar. There is, therefore, a definite target to meet, that of bringing yields to thelevel of the principal producing states <strong>and</strong> then reaching the full potential. With the helpof agricultural scientists <strong>and</strong> irrigation experts, specific measures need to be taken toenhance productivity in different <strong>crop</strong>s. The preliminary ideas in this regard are given inTable 5.5.CropsTable 5.4: Crop-wise Performance <strong>and</strong> Potential in Bihar(Yield: Kg/ha, 2002-03 to 2004-05)ImprovedPractice (I)FarmerPractice (F)Actual2003-04Yield gapI <strong>and</strong> F% between I<strong>and</strong> AWheat 3651 2905 1783 (A) 25.7 50.5Rice 4883 4158 1516 17.4 222.1Maize 3719 - 2374 - 56.6Sugarcane 74420 49440 40990 50.5 81.6Mustard 1385 942 830 47.0 66.9Note: I: Improved Practice; F: Farmer’s Practice.Source: Planning Commission (2008).There is need for augmenting foodgrain production on the existing area. For the next tenyears, a growth of 5 per cent per year may be targeted to raise the present level offoodgrain production from about 119 lakh MT to 222 lakh MT. Major contributions toan increase in foodgrain production can come from rice, maize <strong>and</strong> pulses (see Table5.6). However, a time-bound strategy would be needed for meeting therequirements of high-yielding seeds, development of sustainable small-scaleirrigation projects, strengthening the appropriate marketing set-up in a public-private mode <strong>and</strong> fulfilling the farmers’ dem<strong>and</strong> for other inputs like fertilizers.4
Table 5.5: Suggested Measures to Improve Productivity in Principal Crops,Fruits <strong>and</strong> VegetablesCROPSMEASURESRICE ♦ Use of SRI Technology♦ Propagation of hybrid varieties♦ Propagation of Boro rice supported by Strong Seed Programme♦ Propagation of fine/scented variety of rice for raising income♦ Replacement of long duration varieties with short <strong>and</strong> mediumduration varieties♦ Upgradation <strong>and</strong> strengthening of milling facility <strong>and</strong> strongprocurementMAIZE ♦ Popularization of hybrid varieties supported by strong seed programme♦ Encouraging rabi maize♦ Encouraging baby corn, pop corn, sweet corn <strong>and</strong> quality protein maizevarieties for raising income♦ Proper storage (including drying) <strong>and</strong> procurement of Minimum SupportPrices (MSPs)♦ Promotion of maize-based processing industry (animal feed, corn oil,starch, ethanol, etc.)WHEAT ♦ Timely sowing <strong>and</strong> harvesting♦ Development of short <strong>and</strong> medium duration varieties♦ Encouraging cultivation of short <strong>and</strong> medium duration varieties of rice♦ Mechanization (combining harvesting <strong>and</strong> zero tillage sowing)OILSEEDS ♦ Area expansion♦ Replacing lathyrus <strong>and</strong> low yielding wheat with rai/sarson, sunflower♦ Popularization of high yielding varieties supported by strong seedprogramme♦ Popularization of inter-<strong><strong>crop</strong>ping</strong> of mustard♦ Use of sulphrous fertilizersFRUITS ♦ Rejuvenation of old orchards♦ Area expansion♦ Assured supply of quality planting material♦ High density planting♦ Irrigation with drip <strong>and</strong> micro sprinklers♦ Mechanization of harvesting, grading <strong>and</strong> packing♦ Processing <strong>and</strong> cool chainsVEGETABLES ♦ Area expansion♦ Use of hybrid seeds♦ Integrated pest management♦ Use of growth promoters♦ Irrigation with drip <strong>and</strong> micro sprinklers♦ Mechanization of harvesting, grading <strong>and</strong> packing♦ Processing <strong>and</strong> cool chainsSource: Presentation by Agricultural Scientists <strong>and</strong> Officers of the State Agricultural Department,Government of Bihar before the Steering Group.5
Table 5.6: Indicative Targets of Production of Principal Crops in 2020 (Area in LakhHa, Production in Lakh mt, Productivity in Q/ha.)Particulars Rice Wheat Maize PulsesTotalFoodgrainsOilseedsArea 33.98 20.00 8.65 9.70 72.33 2.00Production 100.98 61.00 45.00 15.00 221.98 2.20Productivity 29.72 30.50 52.00 15.40 27.00 11.00Note: Upl<strong>and</strong> paddy may be replaced by arhar <strong>and</strong> urad; wheat may be replaced by wintermaize. Additional area for pulses will come from current fallow l<strong>and</strong> with <strong>addition</strong>alsource of irrigation.Source: Presentation before the Steering Group by Agriculture Department, Government ofBihar.5.2.2 Adding Value to Existing CropsGiven the abundance of labour, <strong>and</strong> small size of the holdings, there are many <strong>crop</strong>s,especially among fruits, vegetables, <strong>and</strong> spices wherein Bihar can emerge as an importantplayer. With proper quality control, farmers producing the traditional foodgrains should behelped to exploit the niche markets. Efforts could also be made to add <strong>value</strong> to thebyproducts, such as chaff, <strong>and</strong> also to encourage on-farm primary processing of <strong>crop</strong>s.5.2.3 Propagating a Mixed Farming PatternIn moving towards high <strong>value</strong> <strong>crop</strong>s, small-marginal farmers face high risks. One of theways of mitigating the risk is to adopt a mixed <strong><strong>crop</strong>ping</strong> strategy. As in other parts of thecountry, in Bihar also, small farmers always follow a mixed farming <strong>pattern</strong> on theirl<strong>and</strong>. However, there is no systematic planning of the <strong>crop</strong>s. Efforts could be made toencourage farmers to reserve a small area for non-foodgrain <strong>crop</strong>s suited for differentagro-ecological zones of the state.5.2.4 Identifying Areas for Intensive Cultivation of FruitsAlthough Bihar has tremendous potential for the production of fruits <strong>and</strong> vegetables, thestate lags far behind other states such as Bengal <strong>and</strong> Maharashtra in this regard (see Box5.1). As the Horticulture Mission is covering substantial parts of the state, systematicefforts could be made to identify areas for special attention in terms of the growing offruits. The necessary infrastructure to ensure profitable cultivation of fruits needs to beprovided. The indicative targets for fruit production are suggested in Table 5.7.6
Figure 5.1Leading Fruit <strong>and</strong> Vegetable Producing StatesTable 5.7: Targets of Production of Fruits in 2020 (Area in Lakh Ha, Production inLakh MT <strong>and</strong> Productivity in Quintal)ParticularsLitchiMango Banana GuavaMakhanaArea 0.38 1.60 0.48 0.30 0.50Production 5.00 30.00 24.00 4.5 3.00Productivity 13.16 18.75 50.00 15.00 6.00Notes: (i) Additional area will come from <strong>diversification</strong> of cereals particularly rice <strong>and</strong> wheat(ii) (projected rate of growth @10%).Source: Presentation by Agricultural Department, Government of Bihar before the SteeringGroup.5.2.5 Areas with Advantages in Vegetable ProductionThe areas on the periphery of the cities <strong>and</strong> towns can be profitably devoted tovegetable cultivation. For fully exploiting these opportunities, it is imperative to providethe necessary infrastructure of roads, communication <strong>and</strong> cold storage facilities. Theindicative targets for vegetable production are provided in Table 5.8.Table 5.8: Target of Production of Vegetables in 2020Particulars Cauliflower Brinjal Okra Potato Tomato TotalArea 0.70 0.65 0.65 1.50 0.55 4.05Production 14.00 16.25 11.05 30.00 13.75 85.05Productivity 20.00 25.00 17.00 20.00 25.00 21.00Note: Additional area will come from increase in <strong><strong>crop</strong>ping</strong> intensity due to increase in areaunder assured irrigation (projected rate of growth @6%).7
Source: Presentation by Agricultural Department, Government of Bihar before the SteeringGroup.5.2.6 Encouragement to Agro-processingBihar has a very low level of agro processing <strong>and</strong> there is tremendous potential for itsdevelopment (see Box 5.2). For the introduction of the new 'commercial <strong>crop</strong>s' as well asfor exploiting the full <strong>value</strong> of the existing commercial <strong>crop</strong>s including fruits <strong>and</strong>vegetables, processing industries need to be located near the producing areas. Contractfarming with proper safeguards may be encouraged to facilitate production <strong>and</strong> larger<strong>value</strong> retention by the producers.BOX 5.1: Potential for Food Processing in BiharThe <strong>value</strong> <strong>addition</strong> in Fortune Product International (FPI) in India is estimated at about 20 percent. The level of processing varies across segments <strong>and</strong> states. Given the current low levelof processing in the state, there exists a tremendous potential for this, if the rightmanagement, operating environment <strong>and</strong> policy impetus are provided for the sector. Theemerging retail boom provides another big opportunity for the establishment of foodprocessing industries in the state.Bihar already has a few agricultural commodities to cater to the niche markets. For a gainfulutilization of the existing potential, infrastructure creation <strong>and</strong> institutional development holdthe key.A decrease in post-harvest losses by just one per cent will result in a <strong>value</strong> <strong>addition</strong> of Rs. 80crore to the GSDP by foodgrains <strong>and</strong> about Rs. 120 crore by the fruit <strong>and</strong> vegetable sector.Thus, the total <strong>value</strong> <strong>addition</strong> to the state GSDP that can be achieved simply by minimizinglosses by 2 per cent in foodgrains <strong>and</strong> 15 per cent in fruits <strong>and</strong> vegetables, would lead to a<strong>value</strong> <strong>addition</strong> in the GSDP by approximately Rs. 2000 crore.5.3 PROGRAMMES TO ACCOMPLISH STATED GOALS• Ensuring proper use of irrigation water: As observed earlier, Bihar has a higherproportion of area under irrigation as compared to the national average. Also, themain <strong>crop</strong>s of the state, that is, rice, wheat <strong>and</strong> maize, have a higher percentage ofarea under irrigation. Yet the yield of these <strong>crop</strong>s (except for maize) is lower thanthe average yield of the same <strong>crop</strong>s for the country as a whole. There could beseveral factors responsible for low yields, but the inefficient use of water iscertainly one of these. Efforts thus need to be made to ensure the proper use ofwater. For example, there are good prospects of introducing pulses <strong>and</strong> oilseeds inrice fallows with supplementary irrigation facility.8
• Timely supply of the quality inputs: Bihar has a higher use of fertilizersper ha, but the response seems to be below average. There are problems withthe timing of the application as well as the quality of the inputs. In the case ofseeds, adequate supply of the quality seeds seems to be the problem. Stepsshould be taken to ensure timely <strong>and</strong> assured supply of quality inputs. In the caseof fertilizers, there is also a problem of improper mix of various nutrients. At arecent meeting of the National Development Council (NDC), the implementation ofsite-specific nutrient management on 0.5 millions hectares of l<strong>and</strong> was suggested.By itself, this programme may produce an <strong>addition</strong>al 2.6 MT of foodgrains. Thegovernment should encourage a mix of N, P <strong>and</strong> K as well as micro-nutrients aftertaking into account the advice of the agricultural scientists.• Self-provisioning of inputs, <strong>and</strong> appropriate practices on small farms: Forsmall farm agriculture, self-provisioning of inputs is always advantageous, providedthe productivity of these inputs is comparable to the purchased inputs. Modernmethods of seed propagation, selection <strong>and</strong> preservation on farms should bepopularized. Organic manure <strong>and</strong> vermiculture offer great promise for boostingproduction. Efforts are being made in different parts of the country to improve theirproductivity <strong>and</strong> reduce costs. Full advantage needs to be taken of the researchbeing conducted within the state <strong>and</strong> elsewhere to popularize improved qualityinputs. Similarly, practices which reduce costs without sacrificing productivity,such as no-tillage cultivation, may be popularized. It was suggested duringa meeting of the NDC that zero tillage on 1.5 million hectares of l<strong>and</strong> havingexcess soil moisture after rice harvest could enhance rice production by 0.45metric tonnes.• Investment in rural infrastructure: Rural infrastructure is woefully inadequatein Bihar. As a result, extension, input supplies <strong>and</strong> marketing of produce suffer. Thish<strong>and</strong>icap is particularly severe in the case of roads <strong>and</strong> electricity. High priorityshould, therefore, be accorded to overcome this deficit. The Centrally-sponsoredPrime Minister’s Village Roads Programme has started making a mark in the state.Wherever feasible, labour-intensive methods should be used to build roads,especially village <strong>and</strong> farm roads. The existing National Rural EmploymentGuarantee Act (NREGA) could be exploited for this purpose. Similarly, alternativesources of energy, such as wind power, solar power, <strong>and</strong> small hydal powerprojects could be exploited to supplement the generation of energy byconventional sources.9
• Encouraging organizations of the farmers: With the preponderant share ofthe small farmers in the agrarian structure, it is difficult to ensure that the benefitsfor which they are entitled accrue to them without organizations of their own.Bihar's record in this respect is very poor. Cooperative organizations wereencouraged in the rural sector to enhance the bargaining capacity of the smallfarmers. Unfortunately, a large number of cooperatives have become defunct.Efforts should thus be made to revitalize them. Other forms of farmer organizationsfrom cooperative companies to Self-help Groups (SHGs) should also receiveequal encouragement. A cue should be taken from Maharashtra where farmers’organizations like Mahagrapes, Mahabanana <strong>and</strong> Mahamango have become bigexport houses in themselves. Apart from strengthening the bargaining power of theproducers, these organizations will also help in reducing the transaction cost of theinstitutions dealing with credit, marketing <strong>and</strong> input supplies.• Organizational linkages with processing industries: Universal experiencesuggests that there are no economies of scale in agricultural production. But thereare distinct advantages of the larger scale in marketing <strong>and</strong> processing. Thereare examples in the milk <strong>and</strong> sugar sectors wherein the integration of the smallproducers with larger marketing <strong>and</strong> processing entities has proved to bebeneficial for all concerned. Cooperatives in these sectors are largely farmer-ownedenterprises. In several parts of the country, such integration with private firms hasalso proved to be fairly advantageous for the producers. Such arrangements havebeen successful to the extent that the following conditions are fulfilled: a) there isno asymmetry in information, b) there are effective arrangements to protect theweaker parties, that is, the producers, <strong>and</strong> c) there is an effective disputeresolution arrangement in place. Keeping these lessons in the forefront, theintegration of producers with the marketers <strong>and</strong> processors should beencouraged.• Training of farmers in modern methods of <strong>crop</strong> production: Inadequateattention has been placed on training the farmers in the scientific methods ofcultivation under the mistaken assumption that 'the farmers of forty centuries',which our cultivators are, do not need any training. Due to this notion, agriculturalproducers have been denied the benefits of agricultural sciences in their farmingoperations. Proper instructions need to be given to the producers in farmers' fieldschools to enable them to underst<strong>and</strong> modern methods of production <strong>and</strong> topractise them in the field conditions. Lessons learnt in our country <strong>and</strong> in other10
similarly situated countries in the content as well as in pedagogy should bedisseminated after proper adaptation.• Emphasis on dynamic <strong>crop</strong>s: As per past records, certain <strong>crop</strong>s emerge as thedynamic <strong>crop</strong>s of Bihar: maize among cereals, litchi among fruits, <strong>and</strong> potato amongvegetables. These <strong>crop</strong>s also have better prospects for <strong>value</strong> <strong>addition</strong>, <strong>and</strong> these areneutral to scale. Therefore, theywherever the conditions are favourable.can be cultivated even by the small farmers• Location-specific <strong>crop</strong> planning: The specific features of different agro-climaticzones in the state have been recorded earlier. The potentiality of different zonesshould be carefully examined <strong>and</strong> farmers should be advised accordingly. Anillustrative example of the zone-wise <strong>crop</strong> planning is provided in Appendix Table5.9. More details need to be acquired <strong>and</strong> used for this purpose.Appendix Table 5.1: Cropping Pattern in Bihar Agriculture (%)Crop TE 1991 TE 2001 TE 2007Rice 45.08 46.80 46.65Wheat 24.02 26.98 30.03Maize 7.02 8.00 8.78Other Cereals 1.86 0.75 0.68Total Cereals 77.98 82.53 83.28Gram 1.70 1.08 0.86Arhar0.56 0.55 0.51Other Pulses 11.33 7.61 6.96Total Pulses 13.58 9.24 8.34Groundnut 0.00 0.02 0.02Sesamum 0.05 0.11 0.05Rapeseed <strong>and</strong> Mustard 1.11 1.28 1.19Linseed 0.82 0.54 0.40Niger seed 0.38 - -Total Oilseed 2.36 1.93 1.94Jute 1.67 1.80 1.77Mesta 0.30 0.32 0.17Sanhemp 0.03 0.03 0.04Total Fibers 2.00 2.14 1.99Chilies 0.05 0.06 0.04Ginger 0.01 0.01 0.01Turmeric 0.04 0.04 0.04Cori<strong>and</strong>er 0.04 0.03 0.03Garlic 0.03 0.04 0.03Potatoes 1.57 1.84 2.04Onions 0.15 0.19 0.23Sweet Potato 0.20 0.10 0.0711
Appendix Table 5.2: Zone-wise Cropping PatternZones Rice Wheat Maize Gram Lent Rapeseed <strong>and</strong> Mustard SugarcaneilA P Y A P Y A P Y A P Y A A P Y A P YZone 1 13.4(37)*Zone II 8.2(23)Zone III A 2.8(8)Zone III B 11.532)Total 35.99100)17.8(33)9.4(18)3.6(7)22.7(44)53.52(100)13.3 8.6(41)*11.5 4.4(21)12.9-71.519.6* 6.6(31)17.1(40)7.9(18)2.6(6)15.2(36)19.9 2.3(38)17.917.3 0.8(13)23.0* 0.3(13)14.87 21 42.8 20.4 6.06(100)Note: A=Area (lakh hectare), P= Production (lakh MT), Y=Yield.5.4(37)23.5 0.02(3)0.02(3)2.9 6.98 24.1* 0.04 0.03(48)* -48(6)-41.6(11)20 0.14(21)0.5 (3) 16.7 0.52(72)*14.43(100)23.81 0.72(100)0.11(15)0.56(78)0.72(100)*10 0.40(23)7.5 0.15(9)7.8 0.17(10)10.81.0(57)*10 1.74(100)Source: Presentation by Agricultural Scientists <strong>and</strong> Officers of the State Agricultural Department, Government of Bihar before the Steering Group.0.44(47)*0.30(32)0.05(5)0.15(16)0.93(100)0.34(45)0.26(34)0.03(4)0.14(18)0.76(100)7.7 0.93(89)*8.6 0.04(4)6 0.03(3)9.3* 0.04(4)8.2 1.04(100)40.8(88)2.1(5)1.6(3.4)1.5(3.2)46.2(100)43.852.553.3*37.544.413