HermawanOsada, H 1994, '<strong>Trade</strong> Liberalization <strong>and</strong> FDI Incentives in Indonesia : <strong>The</strong> Impact onIndustrial Productivity', <strong>The</strong> Developing Economies, vol. XXXII, no. 4.Pöyhönen, P 1963, 'A Tentative Model for <strong>the</strong> Volume <strong>of</strong> <strong>Trade</strong> between Countries',Weltwirtschaftliches Archiv, vol. 90, pp.93-100.Prabir De 2009, Global economic <strong>and</strong> financial crisis: Indiaʼs tradepotential <strong>and</strong> futureprospects, Asia-Pacific Research <strong>and</strong> Training Network on <strong>Trade</strong> (ARTNeT)Working Paper Series, No.64.Pratiwi Anwar, R 2000, '<strong>The</strong> Development <strong>of</strong> Textile Industry in Indonesia During <strong>The</strong>New Order, A Study With Catching Up Product Cycle Approach', LembaranSejarah, vol. III, no. 1.Rahman, MM 2009, 'Australiaʼs global trade potential: evidence from <strong>the</strong> gravity modelanalysis', Proceedings <strong>of</strong> <strong>the</strong> Oxford Business & Economics Conference, St.Hugh‟ s College, Oxford University, Oxford, UK.Ram, Y & Prasad, BC 2007, 'Assessing Fijiʼs Global <strong>Trade</strong> <strong>Potential</strong> Using <strong>the</strong> GravityModel Approach', School <strong>of</strong> Economics University <strong>of</strong> <strong>The</strong> South Pacific WorkingPaper, viewed 13 October 2010, .Roberts, B 2004, 'A Gravity Study <strong>of</strong> <strong>The</strong> Proposed China-ASEAN Free <strong>Trade</strong> Area',<strong>The</strong> International <strong>Trade</strong> Journal, vol. 18, no.4, pp.335-353.Roberts, BA 2005, 'Analysis <strong>of</strong> <strong>the</strong> proposed China-Asean free trade area: A gravitymodel <strong>and</strong> RCAI approach', <strong>The</strong>sis, National University <strong>of</strong> Singapore, Singapore.Salim, R & Kabir, S 2010, 'Success <strong>of</strong> ASEAN Regional Integration on Intra-regional<strong>Trade</strong>: A Comparative Study with EU’s <strong>Trade</strong> Integration', Proceedings <strong>of</strong> <strong>the</strong> AnnualAsian Business Research Conference, BIAM Foundation 63 New Eskaton, Dhaka,Bangladesh.Shiro Armstrong 2007, 'Measuring <strong>Trade</strong> <strong>and</strong> <strong>Trade</strong> <strong>Potential</strong>: A Survey', Asia PacificEconomic Papers, no.368.Tinbergen, J 1962, Shaping <strong>the</strong> World Economy, Suggestions for an InternationalEconomic Policy, Twentieth Century Fund, New York.Zarsoso, IM & Lehman, FN 2003, 'Augmented Gravity Model: AnEmpirical Application toMercosur-European Union <strong>Trade</strong> Flows', Journal <strong>of</strong> Applied Economics Universidaddel Centro de Estudios Macroeconomicos de Argentina, vol. VI, no.2, pp.291-316.30
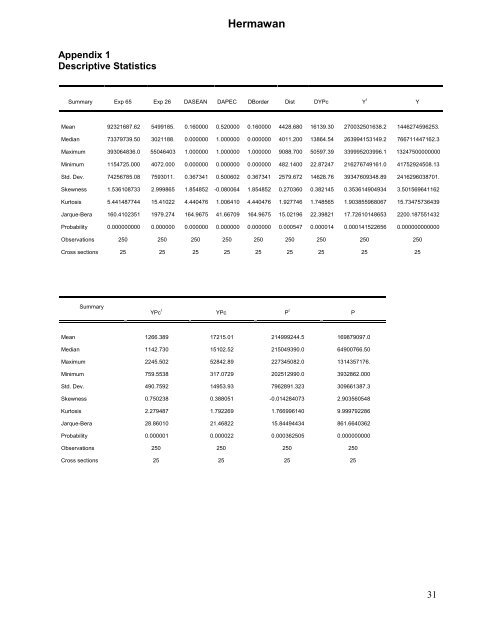
HermawanAppendix 1Descriptive StatisticsSummary Exp 65 Exp 26 DASEAN DAPEC DBorder Dist DYPc Y I YMean 92321687.62 5499185. 0.160000 0.520000 0.160000 4428.680 16139.30 270032501638.2 1446274596253.Median 73379739.50 3021188. 0.000000 1.000000 0.000000 4011.200 13864.54 263994153149.2 766711447162.3Maximum 393064836.0 55046403 1.000000 1.000000 1.000000 9088.700 50597.39 339995203996.1 13247500000000Minimum 1154725.000 4072.000 0.000000 0.000000 0.000000 482.1400 22.87247 216276749161.0 41752924508.13Std. Dev. 74256785.08 7593011. 0.367341 0.500602 0.367341 2579.672 14628.76 39347609348.89 2416296038701.Skewness 1.536108733 2.999865 1.854852 -0.080064 1.854852 0.270360 0.382145 0.353614904934 3.501569641162Kurtosis 5.441487744 15.41022 4.440476 1.006410 4.440476 1.927746 1.748565 1.903855968067 15.73475736439Jarque-Bera 160.4102351 1979.274 164.9675 41.66709 164.9675 15.02196 22.39821 17.72610148653 2200.187551432Probability 0.000000000 0.000000 0.000000 0.000000 0.000000 0.000547 0.000014 0.000141522656 0.000000000000Observations 250 250 250 250 250 250 250 250 250Cross sections 25 25 25 25 25 25 25 25 25SummaryYPc I YPc P I PMean 1266.389 17215.01 214999244.5 169879097.0Median 1142.730 15102.52 215049390.0 64900766.50Maximum 2245.502 52842.89 227345082.0 1314357176.Minimum 759.5538 317.0729 202512990.0 3932862.000Std. Dev. 490.7592 14953.93 7962891.323 309661387.3Skewness 0.750238 0.388051 -0.014284073 2.903560548Kurtosis 2.279487 1.792269 1.766996140 9.999792286Jarque-Bera 28.86010 21.46822 15.84494434 861.6640362Probability 0.000001 0.000022 0.000362505 0.000000000Observations 250 250 250 250Cross sections 25 25 25 2531