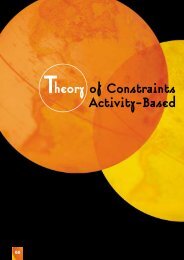
2001; <strong>2002</strong>). An empiricalsurvey was used to collectevidence of current levels ofNet Read<strong>in</strong>ess <strong>in</strong> eight <strong>New</strong><strong>Zealand</strong> <strong>in</strong>dustry sectorsFIGURE 5TourismExport<strong>in</strong>gwith significant roles <strong>in</strong> theBus<strong>in</strong>ess Serviceseconomy and potentialPrimary Sector<strong>in</strong>fluence <strong>in</strong> shap<strong>in</strong>g theEducationfuture prosperity of thecountry (Appendix 1).These <strong>in</strong>cluded Bus<strong>in</strong>essManufactur<strong>in</strong>gRetail<strong>in</strong>gServices, Education,TransportationExport<strong>in</strong>g, Primary Sector,NZ IndustriesManufactur<strong>in</strong>g, RetailTrade, Transportation, andTourism. Respondentsevaluated their organisationfor each factor on a fivepo<strong>in</strong>tLikert scale. NetRead<strong>in</strong>ess scores were then calculated for eachcompany from their factor rat<strong>in</strong>gs and these wereaveraged to provide the mean Net Read<strong>in</strong>ess valuesfor each <strong>in</strong>dustry and the aggregate <strong>New</strong> <strong>Zealand</strong>Industries. Figure 5 shows the mean Net Read<strong>in</strong>essscores for each <strong>in</strong>dustry and the <strong>New</strong> <strong>Zealand</strong>Mean Net Read<strong>in</strong>ess scores for each <strong>in</strong>dustry0 10 20 30 40 50 60 70 80Mean Net Read<strong>in</strong>ess scoresSOURCE: CLARK (2001). NET READINESS IN NEW ZEALAND INDUSTRIES: EMPIRICAL RESULTS, 2001.aggregate result <strong>in</strong> 2001. Note: higher scores reflect<strong>in</strong>creased adaptability, responsiveness to change, andcapabilities for web-based <strong>bus<strong>in</strong>ess</strong> operations.The Tourism <strong>in</strong>dustry was the clear leader of allthe <strong>in</strong>dustries <strong>in</strong> this study with the highest meanNet Read<strong>in</strong>ess score (73.6). This result is veryFIGURE 640%Net Read<strong>in</strong>ess scorecard distributions*35%30%25%20%15%10%5%0%Net Agnostic Net Aware Net Savvy Net Leader Net VisionaryTransportation NZ Industries TourismNote: *Scores of
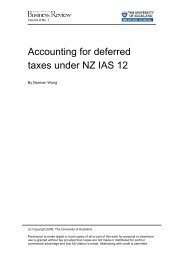
In terms of preparedness for the digital economy, thef<strong>in</strong>d<strong>in</strong>gs suggest that, on average, <strong>New</strong> <strong>Zealand</strong>companies are establish<strong>in</strong>g the capabilities for success<strong>in</strong>terest<strong>in</strong>g as half of the Tourism companies weresmall <strong>in</strong> terms of employees (fewer than 10 FTE)and annual revenues (less than $2 million). Theresult is not surpris<strong>in</strong>g, however, as the levels ofICT uptake <strong>in</strong> this <strong>in</strong>dustry were very high (e.g. 91per cent of the companies had websites). Export<strong>in</strong>gand Bus<strong>in</strong>ess Services ranked second and third withNet Read<strong>in</strong>ess means of 67.0 and 66.2 respectively.At the other end of the scale, Manufactur<strong>in</strong>g andRetail<strong>in</strong>g were <strong>in</strong> sixth and seventh places with veryclose means of 57.4 and 57.1. The Transportation<strong>in</strong>dustry ranked eighth (at the bottom of this list)with a mean Net Read<strong>in</strong>ess score of 56.1.These overall Net Read<strong>in</strong>ess results are consistentwith earlier f<strong>in</strong>d<strong>in</strong>gs signall<strong>in</strong>g <strong>in</strong>dustry-specificfactors impact<strong>in</strong>g on ICT uptake andimplementation. The nature of the product/serviceoffered and the types of <strong>bus<strong>in</strong>ess</strong> operations neededto provide those goods and services will <strong>in</strong>fluencethe types of technology solutions that are applicableand considered for implementation. However, thisscorecard also <strong>in</strong>corporates a wide range of otherfactors such as leadership, governance mechanisms,skills and responsiveness to change.Figure 6 presents the overall distribution of NetRead<strong>in</strong>ess scores for Tourism, Transportation andthe aggregate <strong>New</strong> <strong>Zealand</strong> Industries, us<strong>in</strong>g the setof five categories of <strong>in</strong>creas<strong>in</strong>g e-sophistication(Appendix 2) developed <strong>by</strong> Hartman, Sifonis andKador (<strong>2000</strong>).The Net Read<strong>in</strong>ess scores for the aggregate <strong>New</strong><strong>Zealand</strong> Industries resembles a skewed bell-shapeddistribution with <strong>in</strong>creas<strong>in</strong>g proportions ofcompanies <strong>in</strong> the first three Net Read<strong>in</strong>esscategories; the mean Net Read<strong>in</strong>ess score of 63 isat the lower quartile of the Net Savvy range. Onethirdof the <strong>New</strong> <strong>Zealand</strong> companies were NetSavvy, a quarter were Net Aware and one <strong>in</strong> fivewere Net Leaders, based upon their aggregate scores.Only 6.4 per cent of the <strong>New</strong> <strong>Zealand</strong> companieswere <strong>in</strong> the top Net Visionary category. In terms ofpreparedness for the digital economy, these f<strong>in</strong>d<strong>in</strong>gssuggest that, on average, <strong>New</strong> <strong>Zealand</strong> companiesare mov<strong>in</strong>g forward <strong>in</strong> the right direction –establish<strong>in</strong>g the capabilities for success.Study<strong>in</strong>g a series of <strong>in</strong>dustries enablescomparisons to be made with<strong>in</strong> the sameenvironmental context and time frame. TheTourism and Transportation <strong>in</strong>dustries illustratethe extremes of Net Read<strong>in</strong>ess found <strong>in</strong> this <strong>New</strong><strong>Zealand</strong> research. Tourism had 10 per cent ofcompanies <strong>in</strong> the Net Visionary category and 74per cent <strong>in</strong> the comb<strong>in</strong>ed Net Leader (nexthighest) and Net Savvy (middle) categories. In theTransportation <strong>in</strong>dustry, the largest categories(represent<strong>in</strong>g the most companies) were <strong>in</strong> themiddle and lower categories of Net Read<strong>in</strong>ess – NetSavvy (32 per cent), Net Agnostic (27 per cent) andNet Aware (22 per cent). However, it was <strong>in</strong>terest<strong>in</strong>gto f<strong>in</strong>d that four per cent of the Transportationcompanies were <strong>in</strong> the highest Net Visionarycategory. Indeed <strong>in</strong> all of the <strong>in</strong>dustries <strong>in</strong>vestigatedsome companies were mak<strong>in</strong>g significantcommitments to develop these capabilities andprepar<strong>in</strong>g to <strong>in</strong>corporate more ICTs <strong>in</strong>to their<strong>bus<strong>in</strong>ess</strong> activities (becom<strong>in</strong>g “Net Ready”).Read<strong>in</strong>ess for the digital economy has beenevaluated empirically <strong>in</strong> this research project.Although this Net Read<strong>in</strong>ess scorecard waspublished <strong>in</strong> <strong>2000</strong>, previous studies have beenconducted only on contracts for <strong>in</strong>dividualcompanies. Therefore, no public data was availablefor comparison of these results. External benchmarkdata would be <strong>in</strong>terest<strong>in</strong>g to put these Net Read<strong>in</strong>essscores <strong>in</strong>to perspective. In addition, longitud<strong>in</strong>aldata to observe changes over time with<strong>in</strong> the same<strong>in</strong>dustry would be particularly useful for corporatestrategy and policy development purposes.CONCLUSIONey f<strong>in</strong>d<strong>in</strong>gs from the latest empirical researchKon e-<strong>bus<strong>in</strong>ess</strong> <strong>in</strong> <strong>New</strong> <strong>Zealand</strong> companies andNet Read<strong>in</strong>ess <strong>in</strong> <strong>New</strong> <strong>Zealand</strong> <strong>in</strong>dustries have beenpresented <strong>in</strong> this article. This summary of the currentlevels of e-<strong>bus<strong>in</strong>ess</strong> activities is useful for managersto assist with their understand<strong>in</strong>g of the emerg<strong>in</strong>gtrends <strong>in</strong> the evolv<strong>in</strong>g competitive landscape. Inaddition, this <strong>New</strong> <strong>Zealand</strong>-based research provides“local” data for companies to use for benchmark<strong>in</strong>gpurposes. For policy makers, this data is important11