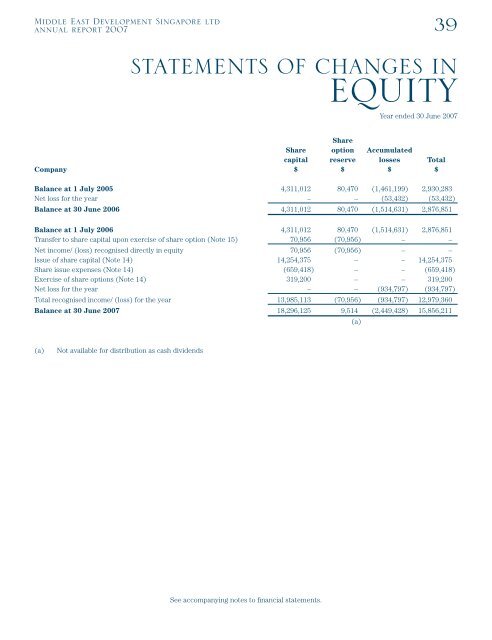
Middle East Development Singapore ltdannual report 2007 39STATEMENTS OF CHANGES INEQUITYYear ended 30 June 2007ShareShare option Accumulatedcapital reserve losses TotalCompany $ $ $ $Balance at 1 July 2005 4,311,012 80,470 (1,461,199) 2,930,283Net loss for the year – – (53,432) (53,432)Balance at 30 June 2006 4,311,012 80,470 (1,514,631) 2,876,851Balance at 1 July 2006 4,311,012 80,470 (1,514,631) 2,876,851Transfer to share capital upon exercise of share option (Note 15) 70,956 (70,956) – –Net income/ (loss) recognised directly in equity 70,956 (70,956) – –Issue of share capital (Note 14) 14,254,375 – – 14,254,375Share issue expenses (Note 14) (659,418) – – (659,418)Exercise of share options (Note 14) 319,200 – – 319,200Net loss for the year – – (934,797) (934,797)Total recognised income/ (loss) for the year 13,985,113 (70,956) (934,797) 12,979,360Balance at 30 June 2007 18,296,125 9,514 (2,449,428) 15,856,211(a)(a)Not available for distribution as cash dividendsSee accompanying notes to financial statements.
40Middle East Development Singapore ltdannual report 2007CONSOLIDATED CASH FLOWSTATEMENTYear ended 30 June 2007Group2007 2006$ $Cash flows from operating activities :Loss for the year (316,651) (193,695)Adjustments for :Income tax expense/(credit) 175,557 (91,795)Depreciation expenses 345,913 365,382Gain on disposal of plant and equipment (31,759) (4,962)Loss on disposal of other investments – 514Interest income (97,525) (20,599)Interest expense 69,410 80,794Operating profit before working capital changes 144,945 135,639Cash restricted in use for more than 3 months (Note 4) (23,592) (6,658)Trade receivables and other receivables (1,173,651) (399,150)Inventories and contract work-in-progress (428,495) 215,163Trade and other payables 337,925 553,435Cash (used in)/ generated from operations (1,142,868) 498,429Income tax paid (296,533) (73,064)Net cash (used in)/ generated from operating activities (1,439,401) 425,365Cash flows from investing activities :Interest received 97,525 20,599Disposal of plant and equipment 63,378 14,251Disposal of other investments – 15,881Purchase of plant and equipment (Note 4) (312,621) (102,869)Net cash used in investing activities (151,718) (52,138)Cash flows from financing activities :Issuance of share capital, net of share issue expenses 13,914,157 –Interest paid (69,410) (80,794)Increase in short-term borrowings 36,077 27,561Decrease in finance leases (136,262) (121,089)Net cash generated from/ (used in) financing activities 13,744,562 (174,322)Net effect of exchange rate changes in consolidating subsidiaries 66,090 (79,546)Net increase in cash 12,219,533 119,359Cash at beginning of year 295,849 196,580Effect of foreign exchange rate adjustments 24,031 (20,090)Cash at end of year (Note 4) 12,539,413 295,849See accompanying notes to financial statements.