Removal of pharmaceuticals during river bank filtration - LEESU
Removal of pharmaceuticals during river bank filtration - LEESU
Removal of pharmaceuticals during river bank filtration - LEESU

Create successful ePaper yourself
Turn your PDF publications into a flip-book with our unique Google optimized e-Paper software.
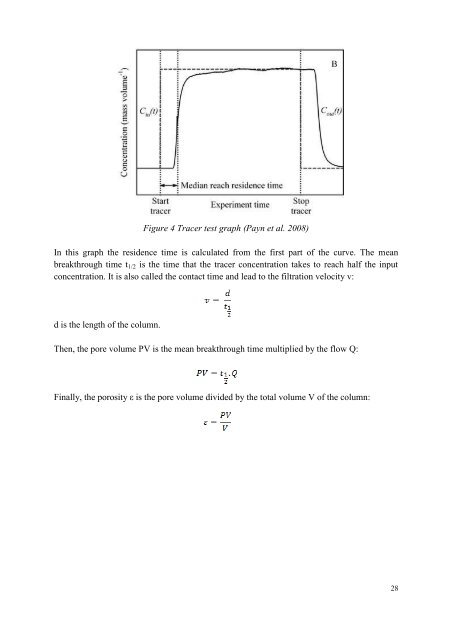
Figure 4 Tracer test graph (Payn et al. 2008)In this graph the residence time is calculated from the first part <strong>of</strong> the curve. The meanbreakthrough time t 1/2 is the time that the tracer concentration takes to reach half the inputconcentration. It is also called the contact time and lead to the <strong>filtration</strong> velocity v:d is the length <strong>of</strong> the column.Then, the pore volume PV is the mean breakthrough time multiplied by the flow Q:Finally, the porosity ε is the pore volume divided by the total volume V <strong>of</strong> the column:28
![[pastel-00730831, v1] Incidence des pratiques d'entretien ... - LEESU](https://img.yumpu.com/50938896/1/184x260/pastel-00730831-v1-incidence-des-pratiques-dentretien-leesu.jpg?quality=85)