Validation of PON1 enzyme activity assays for longitudinal studies
Validation of PON1 enzyme activity assays for longitudinal studies
Validation of PON1 enzyme activity assays for longitudinal studies

You also want an ePaper? Increase the reach of your titles
YUMPU automatically turns print PDFs into web optimized ePapers that Google loves.
Clinica Chimica Acta 402 (2009) 67–74Contents lists available at ScienceDirectClinica Chimica Actajournal homepage: www.elsevier.com/locate/clinchim<strong>Validation</strong> <strong>of</strong> <strong>PON1</strong> <strong>enzyme</strong> <strong>activity</strong> <strong>assays</strong> <strong>for</strong> <strong>longitudinal</strong> <strong>studies</strong>Karen Huen a , Rebecca Richter b , Clement Furlong b , Brenda Eskenazi a , Nina Holland a, ⁎a Center <strong>for</strong> Children's Environmental Health, School <strong>of</strong> Public Health, University <strong>of</strong> Cali<strong>for</strong>nia, Berkeley, CA, United Statesb Department <strong>of</strong> Genome Sciences and Medicine, Division <strong>of</strong> Medical Genetics, University <strong>of</strong> Washington, Seattle, WA, United StatesarticleinfoabstractArticle history:Received 12 August 2008Received in revised <strong>for</strong>m 13 December 2008Accepted 14 December 2008Available online 24 December 2008Keywords:ParaoxonaseArylesterase<strong>PON1</strong> <strong>activity</strong>Enzymatic assayChildrenStorageTechnical variabilityTemperatureOrganophosphatePesticidesOxidative stressFreeze–thawBirth cohortBackground: Paraoxonase (<strong>PON1</strong>) enzymatic <strong>activity</strong> <strong>assays</strong> are used to characterize sensitivity toorganophosphates and oxidative stress. Length <strong>of</strong> sample storage, temperature and other factors mayinfluence variability <strong>of</strong> <strong>PON1</strong> measurements, especially in <strong>longitudinal</strong> <strong>studies</strong>.Methods: Effects <strong>of</strong> assay temperature, storage duration up to 7 y (−80 °C), freeze–thaw cycles, the type <strong>of</strong>specimen (serum or heparinized plasma) and assay variability were evaluated <strong>for</strong> 4 <strong>PON1</strong> substrate-specific<strong>assays</strong> using samples from two pediatric cohorts and laboratory volunteers.Results: Intra- and inter-assay variation, as well as inter-laboratory variability <strong>for</strong> <strong>PON1</strong> activities were b10%.The effect <strong>of</strong> storage duration up to 2 y was minimal. However, after 7 y, arylesterase, paraoxonase, andchlorpyrifos-oxonase activities decreased more noticeably. Similarly, while freeze–thaw cycles did not affectthe <strong>PON1</strong> activities in samples stored b2 y, this factor was more significant after 7 y <strong>for</strong> arylesterase. Assaytemperature and specimen type also influenced <strong>PON1</strong> measurements.Conclusions: Sources <strong>of</strong> technical variability <strong>of</strong> <strong>PON1</strong> <strong>activity</strong> <strong>assays</strong>, including storage duration, freeze–thaw,and temperature should be monitored and minimized through study design, quality control procedures andstatistical methods, especially in <strong>longitudinal</strong> <strong>studies</strong> where specimens may be stored <strong>for</strong> years prior toanalysis.© 2009 Elsevier B.V. All rights reserved.1. IntroductionParaoxonase 1 (<strong>PON1</strong>) is a high-density lipoprotein(HDL)-associated<strong>enzyme</strong>, whose multifunctional activities implicate a role in bothorganophosphate (OP) sensitivity and oxidative stress [1]. Its namestems from the ability to hydrolyze the oxon derivative <strong>of</strong> parathion, aneurotoxic OP pesticide, and further <strong>studies</strong> have shown <strong>PON1</strong> canhydrolyze additional OPs in vitro, including nerve agents such as sarinand soman [2]. OP pesticides are still widely used in agriculture; <strong>for</strong>instance, 2 million pounds <strong>of</strong> chlorpyrifos were applied in the state <strong>of</strong>Cali<strong>for</strong>nia in 2005 [3]. Diseases related to oxidative stress including heartdisease, are some <strong>of</strong> the leading causes <strong>of</strong> mortality and morbidity in theU.S. [4]. Attention towards a potential link between cardiovasculardisease and <strong>PON1</strong> originated from its physical association with HDL. Invitro and in vivo <strong>studies</strong> suggest that <strong>PON1</strong> has antioxidant properties asAbbreviations: <strong>PON1</strong>, Paraoxonase 1; HDL, high-density-lipoprotein; OP, organophosphate;IBD, inflammatory bowel disease; CHAMACOS, Center <strong>for</strong> Health Assessment<strong>of</strong> Mothers and Children <strong>of</strong> Salinas; UCB, University <strong>of</strong> Cali<strong>for</strong>nia, Berkeley; UW,University <strong>of</strong> Washington, Seattle; DZO, diazoxon; CPO, chlorpyrifos-oxon; PO,paraoxon; AREase, arylesterase; IMHP, 2-isopropyl-4-methyl-6-hydroxy pyrimidine;TCP, 3,5,6-trichloro-2-pyridinol; CV, coefficient <strong>of</strong> variation; CI, confidence interval.⁎ Corresponding author. 50 University Hall, School <strong>of</strong> Public Health, UC Berkeley, CA94720-7360, United States. Tel.: +1 510 455 0561; fax: +1 510 643 5426.E-mail address: ninah@berkeley.edu (N. Holland).it prevents LDL and HDL oxidation [5] and protects against atherosclerosis[6,7]. Understanding the determinants <strong>of</strong> <strong>PON1</strong> variability andhow they confer susceptibility to disease or exposures may have broadpublic health significance.Experiments in developing animals suggest that OP exposure,especially in the young, may influence neurodevelopment and growth[8]. In our <strong>longitudinal</strong> birth cohort, CHAMACOS, we previously reportedan association between in utero OP exposure, as measured by urinarymetabolite levels, and decreases in gestational duration [9], abnormalreflexes in neonates [10], and mental development at age two, andincreases in maternal report <strong>of</strong> pervasive development disorder. Since<strong>PON1</strong> can hydrolyze OP oxon derivatives, it may mediate susceptibilityto OP exposures. Berkowitz et al. [11] found that <strong>for</strong> pregnant womenwith chlorpyrifos levels above the limit <strong>of</strong> detection, those women withhigher <strong>PON1</strong> levels had children with larger infant head circumferenceat birth. <strong>PON1</strong> genotypes, including the polymorphism at position 192,have been associated with preterm birth [12,13]. <strong>PON1</strong> genotypes havealso been associated with a myriad <strong>of</strong> other health outcomes related toOP sensitivity and oxidative stress including Alzheimer's disease [14],Parkinson's disease [15], and cardiovascular disease [16]. However,results have been inconsistent. <strong>PON1</strong> <strong>enzyme</strong> levels can range widelyeven between individuals with the same <strong>PON1</strong> genotypes. <strong>PON1</strong> statuswhich considers both <strong>PON1</strong> genotypes and <strong>PON1</strong> levels is a morein<strong>for</strong>mative biomarker <strong>for</strong> use in epidemiological <strong>studies</strong> than <strong>PON1</strong>0009-8981/$ – see front matter © 2009 Elsevier B.V. All rights reserved.doi:10.1016/j.cca.2008.12.019
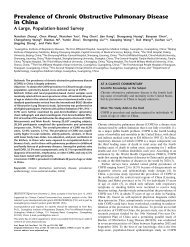
K. Huen et al. / Clinica Chimica Acta 402 (2009) 67–7469Fig. 2. <strong>PON1</strong> <strong>enzyme</strong> <strong>activity</strong> <strong>assays</strong> in serum versus heparinized plasma. AREase (A, B) and ln POase (C, D) <strong>activity</strong> were measured in serum and sodium heparin plasma in children(n=38). Deming regression was used to determine the association between measurements in serum and in plasma. Bland–Altman plots are shown <strong>for</strong> AREase (B) and ln POase (D).The dotted line represents the mean difference between serum and plasma measurements (−13.8 and −0.19 <strong>for</strong> AREase and ln POase, respectively) and the shaded region representsthe 95% confidence interval <strong>for</strong> this difference. The Pearson's correlation coefficient was 0.72 (pb0.0005) and 0.94 (pb0.0005) <strong>for</strong> AREase and ln POase, respectively.(CHAMACOS). The IBD cohort was established as part <strong>of</strong> a pilot study <strong>of</strong> biomarkers <strong>of</strong>genetic damage in pediatric patients [30]. Cases and controls matched by age, sex, andrace were recruited from hospitals that were members <strong>of</strong> the Pediatric IBD Consortium[30,31]. The majority <strong>of</strong> children were Caucasian (82%) and ages ranged from 5- to 17-y(mean=12 y). CHAMACOS is a cohort study <strong>of</strong> the effects <strong>of</strong> pesticide and otherenvironmental exposures on neurodevelopment, growth, and respiratory disease inchildren from primarily Latino farmworker families in the Salinas Valley, CA [32].Located in Monterey County, the Salinas Valley is an area <strong>of</strong> heavy agriculturalproduction where approximately half a million pounds <strong>of</strong> OPs are applied annually [3].Human subjects approval was obtained <strong>for</strong> both projects.To confirm the overall reproducibility <strong>of</strong> the <strong>PON1</strong> <strong>enzyme</strong> <strong>activity</strong> <strong>assays</strong> betweenlaboratories, a set <strong>of</strong> CHAMACOS samples (n=22) were run in parallel both at theHolland laboratory at the University <strong>of</strong> Cali<strong>for</strong>nia, Berkeley (UCB), and at the Furlonglaboratory at the University <strong>of</strong> Washington, Seattle (UW), using identical reagents,s<strong>of</strong>tware, and protocols.For comparison <strong>of</strong> <strong>PON1</strong> <strong>enzyme</strong> <strong>activity</strong> in serum and heparinized plasma,samples from a random selection <strong>of</strong> children from the IBD cohort (n=38) were used.<strong>PON1</strong> <strong>enzyme</strong> <strong>activity</strong> <strong>assays</strong> were per<strong>for</strong>med in parallel samples <strong>of</strong> each type <strong>for</strong> eachindividual.Inter- and intra-assay CVs <strong>of</strong> <strong>PON1</strong> <strong>activity</strong> (4 substrate-specific <strong>assays</strong>) wereexamined by analyzing multiple aliquots <strong>of</strong> heparinized plasma from laboratoryvolunteer samples. Aliquots <strong>of</strong> these samples were assayed in triplicate in the sameexperiment and also as many as 20 times in separate experiments. Inter-assayvariability was measured using parallel aliquots <strong>of</strong> the same sample run on differentdays and within-assay variability was measured by using parallel aliquots <strong>of</strong> the samesample run on different plates but on the same day. Additionally, these laboratoryvolunteer samples were used to examine short term effects (less than two years) <strong>of</strong>assay temperature, storage duration, and freeze–thaw cycles.To compare effects <strong>of</strong> storage duration in samples stored N2 y, a set <strong>of</strong> randomlyselected heparinized plasma samples (n=95) from pregnant women in the CHAMACOScohort [32] were assayed <strong>for</strong> <strong>PON1</strong> <strong>activity</strong> after 2 and 7 y <strong>of</strong> storage at −80 °C. Thesedata were compared to <strong>PON1</strong> enzymatic assay measurements from another set <strong>of</strong>CHAMACOS mothers (n=27) whose samples were also assayed after 2 and 7 y <strong>of</strong>storage. In this set, samples had undergone an additional freeze–thaw cycle betweenthe second and seventh year <strong>of</strong> storage. These samples were used to determine theeffect <strong>of</strong> freeze–thaw cycles on the <strong>PON1</strong> <strong>enzyme</strong> <strong>activity</strong> in samples stored N2 y.2.2. Blood collectionBlood was collected via venipuncture with and without heparin. Blood sampleswere separated into various components and then aliquotted, barcoded <strong>for</strong> identification,and stored (−80 °C) at UCB <strong>for</strong> future use according to Best Practices <strong>for</strong>Biorepositories [33].2.3. Determination <strong>of</strong> <strong>PON1</strong> levels and activitiesSeveral substrate-specific kinetic <strong>enzyme</strong> <strong>assays</strong> have been developed to measure<strong>PON1</strong> phenotype using spectrophotometric methods. The paraoxonase (POase) assaymeasures the rate <strong>of</strong> hydrolysis <strong>of</strong> paraoxon, the oxon derivative <strong>of</strong> the OP pesticideparathion. Similar <strong>assays</strong> (DZOase and CPOase) have been developed <strong>for</strong> diazoxon andchlorpyrifos-oxon, the derivatives <strong>of</strong> OP pesticides diazinon and chlorpyrifos. <strong>PON1</strong>status determination can be resolved using a two substrate assay, which plots DZOaseversus POase activities and reveals a trimodal distribution that resolves subjects by<strong>PON1</strong>192 genotype [19]. It should be noted however that the variation measured by theDZOase assay as employed in <strong>PON1</strong> status determination is not biologically relevant.The high salt concentration utilized in the assay inhibits the <strong>activity</strong> <strong>of</strong> the <strong>PON1</strong> 192 R
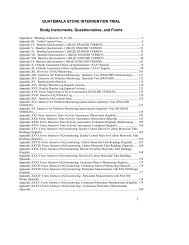
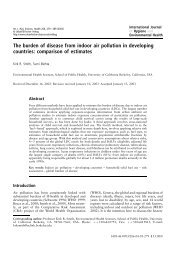
70 K. Huen et al. / Clinica Chimica Acta 402 (2009) 67–74Fig. 3. Inter-assay variability <strong>of</strong> <strong>PON1</strong> <strong>enzyme</strong> <strong>activity</strong> in laboratory control plasma samples. Plasma samples were collected from laboratory volunteers in 2006 and multiple aliquotswere made be<strong>for</strong>e storing at −80 °C. Laboratory control sample 1 (●) and laboratory control 2 (○) were repeatedly assayed to measure inter-assay variability <strong>for</strong> all 4 <strong>PON1</strong> substrates.The CV between <strong>assays</strong> was 7.5% <strong>for</strong> AREase (A) and 9.0% <strong>for</strong> POase (B).all<strong>of</strong>orm even though the <strong>PON1</strong> 192 Q and R all<strong>of</strong>orms have equivalent catalyticefficiencies <strong>for</strong> DZO in vivo [24], and is used intentionally to provide better resolution inthe two substrate plots. <strong>PON1</strong> hydrolysis <strong>of</strong> the aryl ester, phenyl acetate, is used byresearchers to determine arylesterase (AREase) <strong>activity</strong>. Since <strong>PON1</strong> rates <strong>of</strong> phenylacetate hydrolysis do not differ between <strong>PON1</strong> 192 Q and R all<strong>of</strong>orms as they do <strong>for</strong>paraoxon hydrolysis (POase), AREase <strong>activity</strong> is considered a reliable measurement <strong>of</strong><strong>PON1</strong> <strong>enzyme</strong> levels. ELISA and Western blot based methods utilizing <strong>PON1</strong> antibodiesconfirm a high correlation between measured <strong>PON1</strong> levels and arylesterase <strong>activity</strong>(rN0.85) [34,35].In this study, <strong>PON1</strong> <strong>enzyme</strong> <strong>activity</strong> towards 4 substrates (phenyl acetate, diazoxon(DZO), chlorpyrifos-oxon (CPO) and paraoxon (PO)) was measured in either serum orheparinized plasma samples using spectrophotometric methods as described previously[19]. Levels <strong>of</strong> arylesterase (AREase) <strong>activity</strong> were determined in a Molecular DevicesSpectraMax ® PLUS Microplate Spectrophotometer. Rate <strong>of</strong> <strong>for</strong>mation <strong>of</strong> phenol wasmonitored every 15 s (270 nm, ambient temperature) after the addition <strong>of</strong> 20 µl (1:80dilution) <strong>of</strong> plasma or serum to 200 µl <strong>of</strong> a 3.26 mmol/l phenyl acetate solution (9 mmol/lTris–HCL pH 8.0 0.9 mmol/l CaCl 2 ). For DZOase <strong>activity</strong>, hydrolysis <strong>of</strong> DZO was determinedby measuring the rate <strong>of</strong> <strong>for</strong>mation <strong>of</strong> 2-isopropyl-4-methyl-6-hydroxy pyrimidine (IMHP)when 20 µl (1:10 dilution) <strong>of</strong> plasma was added to 200 µl <strong>of</strong> 1 mmol/l DZO (2 M NaCl0.1 mol/l Tris–HCL pH 8.5 2.0 mmol/l CaCl 2 ) at ambient temperature. Since AREase andDZOase <strong>assays</strong> were per<strong>for</strong>med at ambient room temperature, their measurements may besubject to temperature fluctuations present in the laboratory environment. In contrast,CPOase and POase activities were measured at 37 °C (controlled by SpectraMax) andthere<strong>for</strong>e were less prone to temperature fluctuations in the laboratory. Readings weremade every 15 s at 310 nm and 405 nm, respectively. Buffers were prewarmed in a 37 °Cwater bath. Formation <strong>of</strong> 3,5,6-trichloro-2-pyridinol (TCP) and p-nitrophenol wasmeasured after addition <strong>of</strong> 20 µl (1:20 and 1:10 dilution respectively) to 300 μmol/l CPOor 1.2 mmol/l PO, respectively (2 mol/l NaCl 0.1 mol/l Tris–HCL pH 8.5 2.0 mmol/l CaCl 2 ).AREase, DZOase, and CPOase <strong>assays</strong> were carried out using UV transparent 96-well plates.Initial linear rates <strong>of</strong> hydrolysis (0–2 min) in mOD/min were converted to U/ml <strong>for</strong> AREaseand U/l <strong>for</strong> DZOase, CPOase, and POase activities using the following molar extinctioncoefficients: 1.310 mmol/l cm, 3.03 mmol/l cm −1 , 5.56 mmol/l, 18 mmol/l cm, respectively.All samples were assayed in triplicate and the mean <strong>of</strong> the 3 values was used <strong>for</strong>subsequent analyses.2.4. Statistical analysisThe CVs were calculated to summarize overall inter-laboratory variability. DZOaseand POase activities were log trans<strong>for</strong>med in all analyses to normalize theirdistributions. Pearsons's correlation coefficient was calculated to examine correlationsbetween <strong>PON1</strong> activities measured at the UW laboratory vs the UCB laboratory; a pairedt-test was used to determine differences between measurements made at the 2laboratories. Additionally, Deming regression was used to explore associations betweenmeasurements made at the two labs and the Bland–Altman procedure was per<strong>for</strong>medto determine their degree <strong>of</strong> agreement and produce difference plots. Similarly, tocompare <strong>PON1</strong> <strong>enzyme</strong> <strong>activity</strong> measured in serum and heparinized plasma, CV andPearson's correlation coefficients were generated and Deming regression and the BlandAltman procedure were per<strong>for</strong>med. A paired t-test was also used to evaluate differencesbetween <strong>PON1</strong> activities in serum versus plasma. Intra- and inter-assay variability <strong>of</strong> labcontrol samples was described using CV. Linear regression models were used todetermine the effect <strong>of</strong> changes in temperature (from 25°C) on <strong>PON1</strong> enzymatic <strong>activity</strong><strong>for</strong> AREase and DZOase, the 2 <strong>assays</strong> per<strong>for</strong>med at ambient temperature. For this linearregression model, the dependent variable was percent change in <strong>enzyme</strong> <strong>activity</strong> (fromthat measured at 25 °C) and the independent variable was the temperature differencefrom 25 °C. Pearson's correlation analysis and linear mixed models were utilized <strong>for</strong>comparison <strong>of</strong> <strong>PON1</strong> <strong>activity</strong> in CHAMACOS samples (n=95) assayed after 2 and 7 y <strong>of</strong>storage (−80 °C). The linear mixed model allows <strong>for</strong> the evaluation <strong>of</strong> differencesbetween measurements at years 2 and 7, while accounting <strong>for</strong> repeated measures onFig. 4. Effects <strong>of</strong> ambient temperature on <strong>PON1</strong> <strong>enzyme</strong> <strong>activity</strong> <strong>assays</strong>. Both AREase (A) and DZOase (B) activities increased with temperature (pb0.001 <strong>for</strong> both). Linear regressionmodels were used to determine the relative percent change in AREase and DZOase <strong>activity</strong> per degree deviation from 25 °C. Enzyme <strong>activity</strong> increased 4.5% and 2.6% per degreeincrease <strong>for</strong> AREase and DZOase, respectively.
K. Huen et al. / Clinica Chimica Acta 402 (2009) 67–7471Fig. 5. For 95 subjects (●), all 4 <strong>PON1</strong> <strong>enzyme</strong> <strong>activity</strong> <strong>assays</strong>, AREase (A), ln DZOase (B), CPOase (C), and ln POase (D) were run after storage at −80 °C at 2 and 7 y. Measures <strong>of</strong> all 4<strong>enzyme</strong> activities were significantly correlated between samples from the same subjects run after 2 and 7 y <strong>of</strong> storage at −80 °C. Correlation coefficients were 0.51, 0.64. 0.55, and0.79, respectively (pb0.0005 <strong>for</strong> all 4 <strong>enzyme</strong> <strong>activity</strong> <strong>assays</strong>). For a second subset (n=27, ○), samples were also run after storage at 2 and 7 y. However, these samples had beenthrough an additional freeze–thaw cycle be<strong>for</strong>e being rerun at 7 y <strong>of</strong> storage. Correlation coefficients <strong>for</strong> these previously thawed samples were 0.75, 0.95, 0.98, and 0.99 respectively(pb0.0005 <strong>for</strong> all 4 <strong>enzyme</strong> <strong>activity</strong> <strong>assays</strong>).the same subjects and adjusting <strong>for</strong> assay temperature. CV was calculated to examinethe effects <strong>of</strong> multiple freeze–thaw cycles (1–4) on laboratory volunteer samples. Linearmixed models were also used to compare the effects <strong>of</strong> storage duration on samplesthat had been thawed once between years 2 and 7 <strong>of</strong> storage and those that had notbeen thawed over that time. All statistical analyses were per<strong>for</strong>med using STATA 9.0(Statacorp, College Station, TX).3. Results3.1. Inter-laboratory variabilityTo confirm the overall reproducibility <strong>of</strong> the <strong>PON1</strong> enzymatic <strong>assays</strong>between laboratories, a subset <strong>of</strong> 22 CHAMACOS samples were assayed inparallel both in the Holland laboratory at UCB, and at the Furlonglaboratory at UW. We observed low variability between laboratories(Fig. 1).TheaverageCV's<strong>for</strong>AREaseandPOase(<strong>for</strong>the22samplepairs)were 7% and 5%, respectively, and were comparable to intra-lab variability.Enzyme <strong>activity</strong> measures generated by the 2 laboratories were highlycorrelated. Pearson correlation coefficients <strong>for</strong> AREase, ln DZOase, CPOase,and ln POase were 0.97, 0.95, 0.96, 0.99 respectively (pb0.0005 <strong>for</strong> all 4<strong>PON1</strong> <strong>assays</strong>). We did not detect a statistically significant differencebetween laboratories <strong>for</strong> AREase, CPOase, and ln POase activities (paired t-test). However, measurements <strong>of</strong> ln DZOase by the UCB laboratory wereslightly lower (10%) than the UW laboratory (paired t-test; p=0.04). TheDeming regression analyses yielded similar results indicating slightlyhigher DZOase <strong>activity</strong> measurements at the UW laboratory. Comparison<strong>of</strong> the UW laboratory measurements (y) vs the UCB laboratory measurements(x) producedslopes(95%confidence interval in parentheses) <strong>of</strong>0.95(0.84,1.06), 1.32(1.11,1.52), 1.05(0.89,1.21) and 0.97(0.91,1.02) and y-intercepts <strong>of</strong> 0.61(−6.95,8.17), −1.52(−2.53,−0.50), −0.28(−12.6,12.0), and0.18(−0.17,0.53) <strong>for</strong> AREase, ln DZOase, CPOase, and ln POase, respectively.Bland–Altman plots <strong>for</strong> AREase and POase are shown in Fig. 1.3.2. Serum versus heparinized plasma in <strong>PON1</strong> enzymatic <strong>assays</strong><strong>PON1</strong> <strong>enzyme</strong> <strong>activity</strong> was evaluated in samples from 38 childrenfrom the IBD cohort <strong>for</strong> comparison <strong>of</strong> measurements in serum andheparinized plasma. The average intra-assay CV calculated fromtriplicate measurements <strong>of</strong> each sample was about 1% <strong>for</strong> both sampletypes in all 4 <strong>assays</strong>. The average CV between paired serum and plasmasamples (<strong>for</strong> the same subject) was 15.3%, 15.3%, 14.7%, and 15.4% <strong>for</strong>AREase, DZOase, CPOase, and POase, respectively. In addition, <strong>PON1</strong><strong>enzyme</strong> <strong>activity</strong> in serum and plasma were highly correlated (Fig. 2). ThePearson's correlation coefficient was 0.72, 0.65, 0.75, and 0.94 <strong>for</strong>AREase, ln DZOase, CPOase, and ln POase, respectively (pb0.0005 <strong>for</strong> all
72 K. Huen et al. / Clinica Chimica Acta 402 (2009) 67–74<strong>assays</strong>). We found that <strong>PON1</strong> <strong>enzyme</strong> activities were consistently higherin serum than in heparinized plasma both by paired t-test analysis(pb0.01) and Deming regression. The Deming regression equations <strong>for</strong>the difference between heparin plasma (y)andserum(x, 95% confidenceinterval in parentheses) were: y=1.02(0.67,1.38)x−17.3(−65.1,30.6),y =1.12(0.66,1.59)x − 1.31(− 5.80,3.19), y =1.10(0.77,1.42)x − 1571.7(−4066.8,923.4), and y=1.25(1.04,1.46)x−1.79(−3.21,−0.36) <strong>for</strong> AREase,lnDZOase, CPOase, and lnPOase, respectively. The average percentdifference between <strong>PON1</strong> <strong>activity</strong> measured in serum and plasma fromthe same individual was 21.6%, 22.2%, 23.5% and 26.1% <strong>for</strong> AREase,DZOase, CPOase, and POase, respectively. The absolute differences <strong>for</strong>AREase and ln POase are shown in the Bland–Altman plots (Fig. 2Band D).3.3. Intra- and inter-assay variability in plasmaLaboratory volunteer samples were collected in 2006 and multiplealiquots were prepared and stored at −80 °C <strong>for</strong> use as internalcontrol samples in N20 separate experiments over 2 y. In addition,within the same experiment, multiple aliquots <strong>of</strong> the same internalcontrols were prepared and each aliquot was assayed on a differentplate. Within-assay variability as characterized by the average CV <strong>for</strong>within experiment measurements <strong>of</strong> lab control samples wasrelatively low. The CV was 4.3%, 2.8%, 2.1%, and 2.8% <strong>for</strong> AREase,DZOase, CPOase, and POase, respectively. As expected, the inter-assayvariability was slightly higher than intra-assay variability. Theaverage CV between <strong>assays</strong> was 7.5%, 5.7%, 7.6%, and 9.0% <strong>for</strong> AREase,DZOase, CPOase, and POase, respectively (Fig. 3).3.4. Effects <strong>of</strong> temperature on AREase and DZOase <strong>activity</strong>Lab volunteer samples were assayed multiple times at temperaturesranging from 24.7 °C to 29.3 °C. Enzyme <strong>activity</strong> in both <strong>assays</strong>increased with temperature (Fig. 4). Using linear regression analysis,we found that an increase <strong>of</strong> temperature by 1 °C was associated witha 4.5% (p b0.001) and a 2.6% (p b0.001) increase in AREase andDZOase, respectively. Since temperature affected the assay results,we used the equations generated by linear regressions (Fig. 4) topredict AREase and DZOase values <strong>for</strong> a constant temperature <strong>of</strong> 25 °Cin subsequent analyses. As an alternative to using these temperaturecorrection factors, we also found that including an assay temperaturevariable in the statistical model yielded similar results.3.5. Effect <strong>of</strong> storage durationTo examine the effects <strong>of</strong> storage duration in samples stored <strong>for</strong> b2y,we assayed multiple plasma aliquots from the same lab volunteersample at different lengths <strong>of</strong> storage time (−80 °C) ranging from 415 to631 days. All 4 <strong>PON1</strong> <strong>assays</strong> were per<strong>for</strong>med on these aliquots a total <strong>of</strong>17 times. We did not observe a significant association between samplestorage duration and AREase, ln DZOase, and CPOase <strong>activity</strong>. However,we did find a statistically significant decline in ln POase <strong>activity</strong> withstorage duration. The decrease was equivalent to 0.05% in POase <strong>activity</strong>per day <strong>of</strong> storage (p=0.027) and appeared linear <strong>for</strong> the particular range<strong>of</strong> time observed (days 415–631).Plasma samples from 95 CHAMACOS mothers were assayed in2002 at the UW laboratory (after 2 y <strong>of</strong> storage) [24,36] and thenseparate aliquots <strong>of</strong> the same samples that had not yet been thawedwere assayed in 2007 after 2 y <strong>of</strong> storage in the UCB laboratory todetermine the long term effects <strong>of</strong> storage duration. The measurementsmade after 2 y <strong>of</strong> storage were significantly correlated withmeasurements made after 7 y <strong>of</strong> storage <strong>for</strong> all 4 <strong>assays</strong>; however, thecorrelation was highest <strong>for</strong> POase <strong>activity</strong>. The Pearson's correlationcoefficients were 0.51, 0.64, 0.55, and 0.79 <strong>for</strong> AREase, ln DZOase,CPOase, and ln POase respectively (pb0.0005 <strong>for</strong> all 4 <strong>assays</strong>). Onaverage, <strong>enzyme</strong> activities were 17.1%, 39.4%, and 37.6% lower in theset <strong>of</strong> samples stored <strong>for</strong> 7 y as compared to those stored <strong>for</strong> 2 y(pb0.001 <strong>for</strong> all 3 <strong>assays</strong>) <strong>for</strong> AREase, CPOase, and POase respectively(Fig. 5). In contrast, DZOase <strong>activity</strong> was 22.9% higher (pb0.0005).3.6. Effect <strong>of</strong> freeze–thaw cyclesWe used multiple aliquots <strong>of</strong> plasma samples from 5 lab volunteersto examine the effects <strong>of</strong> freeze–thaw cycles on <strong>PON1</strong> <strong>enzyme</strong> <strong>activity</strong> inspecimens stored at −80 °C <strong>for</strong> b2y.Aliquots<strong>of</strong>eachsampleunderwentbetween 1 and 4 freeze–thaw cycles be<strong>for</strong>e <strong>PON1</strong> <strong>assays</strong> wereper<strong>for</strong>med. We did not identify a significant change in <strong>PON1</strong> <strong>activity</strong><strong>for</strong> any <strong>of</strong> the 4 <strong>assays</strong> in samples experiencing a greater number <strong>of</strong>freeze–thaw cycles (Fig. 6). The inter-sample CV (freeze–thaw cycles)was 6.6%, 4.9%, 5.3%, and 6.0% <strong>for</strong> AREase, DZOase, CPOase, and POase,respectively. Thus, freeze–thaw cycles did not appear to affect <strong>PON1</strong><strong>enzyme</strong> <strong>activity</strong> <strong>assays</strong> in samples stored b2 y.In contrast, freeze–thaw cycles did affect <strong>PON1</strong> <strong>enzyme</strong> <strong>activity</strong> insamples that had been stored <strong>for</strong> N2 y. We assayed a subset <strong>of</strong> 27CHAMACOS samples at years 2 and 7 (duration <strong>of</strong> storage at −80 °C).Between years 2 and 7, these samples had undergone one additionalfreeze–thaw cycle. On average, <strong>PON1</strong> <strong>enzyme</strong> <strong>activity</strong> was 25.7% lower(pb0.0005) <strong>for</strong> AREase and 14.2% higher <strong>for</strong> DZOase <strong>activity</strong> (p=0.001)after adjusting <strong>for</strong> temperature (Fig. 5). In comparison to the 95CHAMACOS samples which had not been thawed between years 2 and 7,the thawed samples experienced a more dramatic decrease in AREase<strong>activity</strong> (17.1% <strong>for</strong> unthawed samples and 25.7% <strong>for</strong> thawed samples)that was statistically significant (pb0.0005). For ln DZOase, both thawedand unthawed samples had increased <strong>activity</strong> at year 7. For CPOase andln POase <strong>activity</strong>, the additional freeze–thaw cycle did not significantlyaffect <strong>PON1</strong> <strong>enzyme</strong> <strong>activity</strong> differences between samples stored <strong>for</strong> 2Fig. 6. Effect <strong>of</strong> freeze–thaw cycles on <strong>PON1</strong> <strong>enzyme</strong> <strong>activity</strong>. Five lab control samples were frozen at −80 °C (sample 1 ♦; sample 2 ●; sample 3 ▲; sample 4 ■; sample 5 ✱) andunderwent 1–4 freeze–thaw cycles over 2 weeks. Average within-sample CV (%) was 6.5, 4.9, 5.3, and 6.0 <strong>for</strong> AREase, DZOase, CPOase, and POase, respectively.
K. Huen et al. / Clinica Chimica Acta 402 (2009) 67–7473and 7 y(p=0.39 and p=0.87, respectively) and the decrease in <strong>activity</strong>was comparable to unthawed samples (36.2% and 33.5%, respectively).4. DiscussionIn this study, we sought to characterize sources <strong>of</strong> technicalvariability <strong>for</strong> <strong>PON1</strong> substrate-specific <strong>enzyme</strong> <strong>activity</strong> <strong>assays</strong>. Wefocused particularly on <strong>longitudinal</strong> <strong>studies</strong>, which can generatethousands <strong>of</strong> banked samples that are <strong>of</strong>ten analyzed after differentperiods <strong>of</strong> time have elapsed. We observed differences in measurable<strong>PON1</strong> <strong>enzyme</strong> <strong>activity</strong> due to several sources: (1) use <strong>of</strong> heparinizedplasma versus serum, (2) assay temperature, (3) duration <strong>of</strong> storage, and(4) freeze–thaw cycles; <strong>of</strong> these sources, duration <strong>of</strong> storage had thegreatest impact on <strong>PON1</strong> <strong>activity</strong>, particularly in samples stored <strong>for</strong> morethan two years. We found relatively low intra- and inter- assay CVs(b10%) <strong>for</strong> control samples; intra- and inter-assay CV <strong>for</strong> POase werecomparable to those previously reported in serum (3.5% and 2.7%,respectively) [22]. Additionally, we observed low inter-laboratoryvariability <strong>for</strong> samples run in parallel using identical reagents, s<strong>of</strong>tware,and protocols at UCB and UW. These results establish good reproducibility<strong>of</strong> the <strong>PON1</strong> enzymatic <strong>assays</strong> and support their suitability <strong>for</strong> usein epidemiologic <strong>studies</strong>. However, these sources <strong>of</strong> technical variabilityshould be carefully considered in study design, subsequent statisticalanalysis, and interpretation <strong>of</strong> findings.While a previous study <strong>of</strong> storage time on serum stored at −20 °Creported no significant change in AREase <strong>activity</strong> over the course <strong>of</strong>6months[28], we observed lower <strong>activity</strong> in all <strong>assays</strong> except DZOase insamples stored <strong>for</strong> 7 y at −80 °C. Similar results were reported in one study,which described a gradual decrease in serum POase <strong>activity</strong> in samplesstored up to 4 y at −20 °C [29] and in another which found that AREase,DZOase, and POase <strong>activity</strong> in plasma samples stored up to 6 y at −20 °Cdecreased over time [37]. In <strong>longitudinal</strong> <strong>studies</strong>, it will be important toconsider the effects <strong>of</strong> storage duration on <strong>PON1</strong> <strong>activity</strong>, especially whencomparing measurements from samples stored <strong>for</strong> varying lengths <strong>of</strong>time. Stenzel et al. [37] calculated a half-life <strong>of</strong> 9.5 y <strong>for</strong> POase <strong>activity</strong>stored at −20 °C by fitting an exponential function to their data; thus it maybe possible to adjust <strong>for</strong> storage duration in <strong>longitudinal</strong> <strong>studies</strong> by fitting asimilar model.Our analysis <strong>of</strong> long term storage duration compared <strong>PON1</strong> <strong>enzyme</strong><strong>activity</strong> measurements made in the UW laboratory to measurementsmade on the same samples 5 y later at the UCB laboratory. We mustacknowledge that storage duration could not be isolated as the onlysource <strong>of</strong> variation since factors that may have differed between the 2laboratories (i.e., possible changes over time with respect to reagents,equipment, or procedures) may have also affected <strong>PON1</strong> measurements.However, our inter-laboratory exercise established good comparabilitybetween the two laboratories <strong>for</strong> concurrent experiments (using thesame protocols and reagents).We did not observe any effect <strong>of</strong> multiple freeze–thaw cycles (up to4) on <strong>PON1</strong> <strong>enzyme</strong> <strong>activity</strong> in the UCB volunteer samples (storageduration up to 2 y). However, in samples stored up to 7 y (−80 °C),freeze–thaw cycles resulted in decreased AREase and slightly increasedDZOase <strong>activity</strong>. Similar to storage duration, multiple freeze–thaw cyclesdo not seem to impact <strong>PON1</strong> <strong>enzyme</strong> <strong>activity</strong> as dramatically in one totwo year old samples as compared to 7 y old samples. It is also importantto note that the impact <strong>of</strong> freeze–thaw cycles was not consistent <strong>for</strong> all 4substrate-specific <strong>assays</strong>, but mostly affected decreased AREase <strong>activity</strong>.One possible explanation is that unlike the 3 other substrate-specific<strong>PON1</strong> <strong>assays</strong>, AREase assay uses an aryl ester substrate (phenyl acetate)rather than a phosphotriester (DZO, CPO, and PO). A site-directedmutagenesis study <strong>of</strong> <strong>PON1</strong> demonstrated that the active sites <strong>for</strong> arylesters and phosphotriesters are different [38]. Thus, it is not unexpectedthat the rates <strong>of</strong> hydrolysis <strong>of</strong> the different substrates could bedifferentially affected by storage conditions.Temperature was positively correlated with AREase and DZOase<strong>activity</strong>. These two <strong>assays</strong> are <strong>of</strong>ten per<strong>for</strong>med at ambient roomtemperature and thus may be affected when temperature fluctuationscannot be avoided in the laboratory environment. To minimize theseeffects, one could (1) adjust <strong>for</strong> temperature variation using statisticalmodeling or (2) ensure temperature stabilization by setting the microplatespectrophotometer temperature to some level slightly higher than typicalroom temperature.Specimen type is another source <strong>of</strong> variability <strong>for</strong> <strong>PON1</strong> <strong>enzyme</strong><strong>activity</strong>. Some <strong>studies</strong> may only have certain specimens available <strong>for</strong>analyses; there<strong>for</strong>e it is important to determine what potentialdifferences may arise when per<strong>for</strong>ming <strong>assays</strong> in varying specimentypes such as serum or heparinized plasma. In our study, <strong>PON1</strong> <strong>activity</strong>was higher in serum than plasma. However, <strong>enzyme</strong> <strong>activity</strong> in serumand heparinized plasma samples were highly correlated. Our resultscorroborated those reported by Brackley et al. [29], who also reportedhigher <strong>PON1</strong> <strong>enzyme</strong> <strong>activity</strong> in serum versus plasma. They suggest thatfibrin clots retain water, resulting in slightly higher serum concentrations.These differences between serum and plasma <strong>PON1</strong> <strong>activity</strong>should be taken into account when designing a study and comparingvalues to those reported in other <strong>studies</strong>.This study provided an opportunity to carefully examine challengesthat may exist when using <strong>PON1</strong> <strong>assays</strong> in <strong>longitudinal</strong> and pediatricdisease <strong>studies</strong>. Utilizing samples from 2 pediatric cohorts, we were ableto explore a comprehensive set <strong>of</strong> variability factors. Additionally,samples from these cohorts had been stored <strong>for</strong> long periods <strong>of</strong> time,allowing us to determine the effects <strong>of</strong> storage time over much greaterdurations than most previous <strong>studies</strong>.<strong>PON1</strong> has been implicated in many important pathways affectinghealth, including OP sensitivity and oxidative stress, and the number <strong>of</strong><strong>studies</strong> <strong>of</strong> PON genotypes and <strong>activity</strong> is growing quickly [1,39–41].Measurement <strong>of</strong> <strong>PON1</strong> levels as determined by enzymatic <strong>assays</strong> isessential <strong>for</strong> determination <strong>of</strong> <strong>PON1</strong> status and provides more in<strong>for</strong>mationthan <strong>PON1</strong> genotype alone. Thus, the use <strong>of</strong> <strong>PON1</strong> enzymatic <strong>assays</strong> tocharacterize host variability may help clarify potential susceptibilities tomajor health endpoints. Our study demonstrates that results are relativelyreproducible within and between <strong>assays</strong> and also between laboratorieswhen using a standardized protocol. Sources <strong>of</strong> technical variabilityincluding temperature, storage duration, and freeze–thaw cycles shouldbe monitored and minimized either via study design or through statisticaladjustment. It is <strong>of</strong> particular concern <strong>for</strong> <strong>longitudinal</strong> <strong>studies</strong>, where longterm specimen handling and storage are more likely to affect results.AcknowledgementsWe are grateful to the laboratory and clinical staff and participants<strong>of</strong> the CHAMACOS study and the Pediatric IBD consortium <strong>for</strong> theircontributions. This publication was made possible by grant numberR03 DK60617 from the National Institutes <strong>of</strong> Health (NIH), R826886and R82670901 from the U.S. Environmental Protection Agency(EPA), R01ESO12503-03, PO1 ES009605, ES09883, ES09601, andES04696 from the National Institute <strong>of</strong> Environmental Health Science(NIEHS). Its contents are solely the responsibility <strong>of</strong> the authors anddo not necessarily represent the <strong>of</strong>ficial views <strong>of</strong> the NIEHS, NIH andthe EPA.References[1] Li HL, Liu DP, Liang CC. Paraoxonase gene polymorphisms, oxidative stress, anddiseases. J Mol Med 2003;81:766–79.[2] Costa LG, Cole TB, Vitalone A, Furlong CE. Measurement <strong>of</strong> paraoxonase (<strong>PON1</strong>)status as a potential biomarker <strong>of</strong> susceptibility to organophosphate toxicity. ClinChim Acta 2005;352:37–47.[3] DPR, Pesticide Use Report, Annual. Sacramento, CA: Department <strong>of</strong> PesticideRegulation, Cali<strong>for</strong>nia Environmental Protection Agency, 2005; 2005.[4] Rosamond W, Flegal K, Friday G, et al. Heart disease and stroke statistics—2007update: a report from the American Heart Association Statistics Committee andStroke Statistics Subcommittee. Circulation 2007;115:e69–e171.[5] Aviram M, Rosenblat M. Paraoxonases 1, 2, and 3, oxidative stress, and macrophagefoam cell <strong>for</strong>mation during atherosclerosis development. Free Radic Biol Med2004;37:1304–16.
74 K. Huen et al. / Clinica Chimica Acta 402 (2009) 67–74[6] Rosenblat M, Gaidukov L, Khersonsky O, et al. The catalytic histidine dyad <strong>of</strong> highdensity lipoprotein-associated serum paraoxonase-1 (<strong>PON1</strong>) is essential <strong>for</strong> <strong>PON1</strong>-mediated inhibition <strong>of</strong> low density lipoprotein oxidation and stimulation <strong>of</strong>macrophage cholesterol efflux. J Biol Chem 2006;281:7657–65.[7] Tward A, Xia YR, Wang XP, et al. Decreased atherosclerotic lesion <strong>for</strong>mation inhuman serum paraoxonase transgenic mice. Circulation 2002;106:484–90.[8] Eskenazi B, Bradman A, Castorina R. Exposures <strong>of</strong> children to organophosphatepesticides and their potential adverse health effects. Environ Health Perspect1999;107 Suppl 3:409–19.[9] Eskenazi B, Harley K, Bradman A, et al. Association <strong>of</strong> in utero organophosphatepesticide exposure and fetal growth and length <strong>of</strong> gestation in an agriculturalpopulation. Environ Health Perspect 2004;112:1116–24.[10] Young JG, Eskenazi B, Gladstone EA, et al. Association between in utero organophosphatepesticide exposure and abnormal reflexes in neonates. Neurotoxicology2005;26:199–209.[11] Berkowitz GS, Wetmur JG, Birman-Deych E, et al. In utero pesticide exposure,maternal paraoxonase <strong>activity</strong>, and head circumference. Environ Health Perspect2004;112:388–91.[12] Chen J, Chan W, Wallenstein S, Berkowitz G, Wetmur JG. Haplotype–phenotyperelationships <strong>of</strong> paraoxonase-1. Cancer Epidemiol Biomark Prev 2005;14:731–4.[13] Lawlor DA, Gaunt TR, Hinks LJ, et al. The association <strong>of</strong> the <strong>PON1</strong> Q192Rpolymorphism with complications and outcomes <strong>of</strong> pregnancy: findings from theBritish Women's Heart and Health cohort study. Paediatr Perinat Epidemiol2006;20:244–50.[14] Erlich PM, Lunetta KL, Cupples LA, et al. Polymorphisms in the PON gene cluster areassociated with Alzheimer disease. Hum Mol Genet 2006;15:77–85.[15] Zintzaras E, Hadjigeorgiou GM. Association <strong>of</strong> paraoxonase 1 gene polymorphismswith risk <strong>of</strong> Parkinson's disease: a meta-analysis. J Hum Genet 2004;49:474–81.[16] Bhattacharyya T, Nicholls SJ, Topol EJ, et al. Relationship <strong>of</strong> paraoxonase 1 (<strong>PON1</strong>)gene polymorphisms and functional <strong>activity</strong> with systemic oxidative stress andcardiovascular risk. Jama 2008;299:1265–76.[17] Browne RW, Koury ST, Marion S, Wilding G, Muti P, Trevisan M. Accuracy andbiological variation <strong>of</strong> human serum paraoxonase 1 <strong>activity</strong> and polymorphism(Q192R) by kinetic <strong>enzyme</strong> assay. Clin Chem 2007;53:310–7.[18] Jarvik GP, Rozek LS, Brophy VH, et al. Paraoxonase (<strong>PON1</strong>) phenotype is a betterpredictor <strong>of</strong> vascular disease than is <strong>PON1</strong>(192) or <strong>PON1</strong>(55) genotype.Arterioscler Thromb Vasc Biol 2000;20:2441–7.[19] Richter RJ, Furlong CE. Determination <strong>of</strong> paraoxonase (<strong>PON1</strong>) status requires morethan genotyping. Pharmacogenetics 1999;9:745–53.[20] Krisch K. Enzymatic hydrolysis <strong>of</strong> diethyl-p-nitrophenylphosphate (E600) byhuman serum. Z Clin Chem 1968;6:41–5.[21] Marton A, Kalow W. Studies on aromatic esterase and cholinesterase <strong>of</strong> humanserum. Can J Biochem Physiol 1959;37:1367–73.[22] Charlton-Menys V, Liu Y, Durrington PN. Semiautomated method <strong>for</strong> determination <strong>of</strong>serum paraoxonase <strong>activity</strong> using paraoxon as substrate. Clin Chem 2006;52:453–7.[23] Richter R, Jampsa R, Jarvik G, Costa LG, Furlong CE. Determination <strong>of</strong> Paraoxonase 1(<strong>PON1</strong>) status and genotypes at specific polymorphic sites. In: Maines MD, Costa LG,Reed DJ, Hodgson E, editors. Current Protocols in Toxicology. NY, NY: John Wiley andSons; 2004. p. 4.12.11–14.12.19.[24] Furlong CE, Holland N, Richter RJ, Bradman A, Ho A, Eskenazi B. <strong>PON1</strong> status <strong>of</strong>farmworker mothers and children as a predictor <strong>of</strong> organophosphate sensitivity.Pharmacogenet Genomics 2006;16:183–90.[25] Cole TB, Jampsa RL, Walter BJ, et al. Expression <strong>of</strong> human paraoxonase (<strong>PON1</strong>)during development. Pharmacogenetics 2003;13:357–64.[26] Vineis P, Perera F. Molecular epidemiology and biomarkers in etiologic cancer research:the new in light <strong>of</strong> the old. Cancer Epidemiol Biomarkers Prev 2007;16:1954–65.[27] Rundle AG, Vineis P, Ahsan H. Design options <strong>for</strong> molecular epidemiology researchwithin cohort <strong>studies</strong>. Cancer Epidemiol Biomarkers Prev 2005;14:1899–907.[28] Nakanishi M, Takanami Y, Maruyama T, et al. The ratio <strong>of</strong> serum paraoxonase/arylesterase <strong>activity</strong> using an improved assay <strong>for</strong> arylesterase <strong>activity</strong> to discriminate<strong>PON1</strong>(R192) from <strong>PON1</strong>(Q192). J Atheroscler Thromb 2003;10:337–42.[29] Brackley M, Carro-Ciampi G, Stewart DJ, Lowden JA, Ray AK, Kalow W. Stability <strong>of</strong>the paraoxonase phenotyping ratio in collections <strong>of</strong> human sera with differingstorage times. Res Commun Chem Pathol Pharmacol 1983;41:65–78.[30] Holland N, Harmatz P, Golden D, et al. Cytogenetic damage in blood lymphocytesand exfoliated epithelial cells <strong>of</strong> children with inflammatory bowel disease.Pediatr Res 2007;61:209–14.[31] Heyman MB, Kirschner BS, Gold BD, et al. Children with early-onset inflammatorybowel disease (IBD): analysis <strong>of</strong> a pediatric IBD consortium registry. J Pediatr2005;146:35–40.[32] Eskenazi BBA, Gladstone EA, Jaramillo S, Birch K, Holland NT. CHAMACOS, a <strong>longitudinal</strong>birth cohort study: lessons from the fields. J Childrens Healt 2003;1:3–27.[33] ISBER. Best practices <strong>for</strong> repositories: collection, storage, retrieval and distribution<strong>of</strong> biological materials <strong>for</strong> research. Cell Preservat Technol 2008;6:3–58.[34] Connelly PW, Maguire GF, Picardo CM, Teiber JF, Draganov D. Development <strong>of</strong> animmunoblot assay with infrared fluorescence to quantify paraoxonase 1 in serumand plasma. J Lipid Res 2008;49:245–50.[35] Kujiraoka T, Oka T, Ishihara M, et al. A sandwich <strong>enzyme</strong>-linked immunosorbentassay <strong>for</strong> human serum paraoxonase concentration. J Lipid Res 2000;41:1358–63.[36] Holland N, Furlong C, Bastaki M, et al. Paraoxonase polymorphisms, haplotypes,and <strong>enzyme</strong> <strong>activity</strong> in Latino mothers and newborns. Environ Health Perspect2006;114:985–91.[37] Stenzel J, Worek F, Eyer P. Preparation and characterization <strong>of</strong> dialkylphosphorylobidoximeconjugates, potent anticholinesterase derivatives that are quickly hydrolyzedby human paraoxonase (<strong>PON1</strong>192Q). Biochem Pharmacol 2007;74:1390–400.[38] Khersonsky O, Tawfik DS. The histidine 115-histidine 134 dyad mediates the lactonase<strong>activity</strong> <strong>of</strong> mammalian serum paraoxonases. J Biol Chem 2006;281:7649–56.[39] van Himbergen TM, van Tits LJ, Roest M, Stalenhoef AF. The story <strong>of</strong> <strong>PON1</strong>: how anorganophosphate-hydrolysing <strong>enzyme</strong> is becoming a player in cardiovascularmedicine. Neth J Med 2006;64:34–8.[40] James RW. A long and winding road: defining the biological role and clinicalimportance <strong>of</strong> paraoxonases. Clin Chem Lab Med 2006;44:1052–9.[41] Marchegiani F, Marra M, Olivieri F, et al. Paraoxonase 1: genetics and activitiesduring aging. Rejuvenation Res 2008;11:113–27.