The Danger of Incomplete Combustion for Environment, Health, and ...
The Danger of Incomplete Combustion for Environment, Health, and ...
The Danger of Incomplete Combustion for Environment, Health, and ...

Create successful ePaper yourself
Turn your PDF publications into a flip-book with our unique Google optimized e-Paper software.
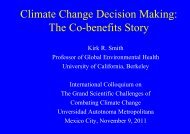
<strong>The</strong> <strong>Danger</strong> <strong>of</strong> <strong>Incomplete</strong> <strong>Combustion</strong> <strong>for</strong><strong>Environment</strong>, <strong>Health</strong>, <strong>and</strong> Climate<strong>The</strong> Impacts <strong>of</strong> Humanity’s Oldest OccupationKirk R. Smith, MPH, PhD施 君 , 公 共 卫 生 学 硕 士 , 博 士Pr<strong>of</strong>essor <strong>of</strong> Global <strong>Environment</strong>al <strong>Health</strong>University <strong>of</strong> Cali<strong>for</strong>nia, Berkeley美 国 国 家 科 学 院 院 士 (1997)
300-400 thous<strong>and</strong> years ago, the hearth becamea regular feature in human habitation“On the earliest evidence <strong>for</strong>habitual use <strong>of</strong> fire”Roebroeks <strong>and</strong> Villa,PNAS, 2011
Householdsusing biomassor coal tocook today20051990Comparative RiskAssessment (CRA)2011- preliminary,
Biomass Cooking in History• Only quite recently in human history did more than half<strong>of</strong> households use non-solid fuels <strong>for</strong> cooking – perhapsaround 1980.• Today, ~43% use solid fuels, about 3 billion people• Although the percentage is dropping, the absolutenumber is still rising.• Perhaps 20 million people a year are added to the totaleach year.• Indeed, there are more people using solid fuels today <strong>for</strong>cooking than the total world population in 1950• Or any year previously
A problem that has lastedone-third <strong>of</strong> a million years<strong>and</strong> is showing no sign <strong>of</strong>quickly going away by itself.
Rural Energy in China: 2004TotalHouseholdsElectricity7%Coal35%LPG1%Kerosene2%Crop wastes33%Biogas1.2%Electricity3.7% LPGCoal 1.2%12.9%Kerosene0.1%Cropwastes44.3%Biogas1%Wood21%Wood36.6%70% <strong>of</strong> totalMinistry <strong>of</strong> AgricultureNational Bureau <strong>of</strong> Statistics
Household Energy in China• ~60% <strong>of</strong> China’s population is rural.• >70% <strong>of</strong> energy use in rural areas is simple solidbiomass (wood, agricultural wastes)• >15% as coal• Thus, it is still true to say that in China mostpeople rely on biomass fuels <strong>for</strong> most <strong>of</strong> theirenergy• Substitution <strong>of</strong> biomass by coal is increasing –probably worse <strong>for</strong> health <strong>and</strong> climate
Rural energysituation is typicallycomplex:
Road Map• Why is there so much pollution?• What are the major constituents <strong>of</strong> thesmoke?• What adverse health effects have beenmeasured?• What is the climate connection?• What interventions have been evaluated inChina?
Woodsmoke is natural – how can it hurt you?Or, since wood is mainly just carbon, hydrogen, <strong>and</strong> oxygen,doesn’t it just change to CO 2 <strong>and</strong> H 2 O when it is combinedwith oxygen (burned)?Reason: the combustion efficiency is far less than 100%
Energy flows in a well-operating traditionalwood-fired Chinese cooking stoveA Toxic Waste Factory!!Wood: 1 kg15.3 MJTraditional 15% moisture StoveTypical biomass cookstoves convert 6-20% <strong>of</strong> thefuel carbon to toxic substancesInto Pot2.8 MJ18%In PIC1.2 MJ8%Waste Heat11.3 MJ74%PIC = products <strong>of</strong> incomplete combustion = CO, HC, C, etc.Source:Zhang,et al.,2000
Toxic Pollutants in Biomass Fuel Smokefrom Simple (poor) <strong>Combustion</strong>• Small particles, CO, NO 2• Hydrocarbons– 25+ saturated hydrocarbons such as n-hexane– 40+ unsaturated hydrocarbons such as 1,3 butadiene– 28+ mono-aromatics such as benzene & styrene– 20+ polycyclic aromatics such as benzo()pyrene• Oxygenated organics– 20+ aldehydes including <strong>for</strong>maldehyde & acrolein– 25+ alcohols <strong>and</strong> acids such as methanol– 33+ phenols such as catechol & cresol– Many quinones such as hydroquinone Source: Naeher et al,J Inhal Tox, 2007– Semi-quinone-type <strong>and</strong> other radicals• Chlorinated organics such as methylene chloride <strong>and</strong> dioxin
<strong>Health</strong>-Damaging Air Pollutants FromTypical Woodfired Cookstove in China.Typical <strong>Health</strong>-basedSt<strong>and</strong>ardsWood: 1.0 kgPer Hourin 15 ACH40 m3 kitchenTypical IndoorConcentrationsCarbon Monoxide:150 mg/m3Particles3.3 mg/m3Benzene0.8 mg/m31,3-Butadiene0.15 mg/m3Formaldehyde0.7 mg/m310 mg/m30.1 mg/m30.002 mg/m30.0003 mg/m30.1 mg/m3Best single indicatorIARC Group 1 Carcinogens
How muchIll-health?
ALRI/PneumoniaDiseases <strong>for</strong> which we haveepidemiological studiesCOPDLung cancer(coal)<strong>The</strong>se three diseases were included in the2004 Comparative Risk AssessmentManaged <strong>and</strong> published by theWorld <strong>Health</strong> OrganizationFirst ever comprehensive risk assessmentwith consistent rules <strong>of</strong> evidence<strong>and</strong> common databases
Major Causes <strong>of</strong> Death in China0.0% 5.0% 10.0% 15.0% 20.0%CancerStrokeCOPDIschemic HeartChronic Obstructive Lung DiseaseARIPerinatalAcute Respiratory InfectionsTBSuicideRoad TrafficHypertensive HeartThose diseaseseach causing morethan 2% <strong>of</strong> total
Global Burden <strong>of</strong> Disease from Top 10 Risk Factorsplus selected other risk factorsPercent <strong>of</strong> All DALYs0.0% 2.0% 4.0% 6.0% 8.0% 10.0%UnderweightUnsafe sexBlood pressureTobaccoAlcoholUnsafe water/sanitationChild cluster vaccination*CholesterolLack <strong>of</strong> Malaria control*Indoor smoke from solid fuels1.6 million prematuredeaths/yearOverweightOccupational hazards (5 kinds)Road traffic accidents*Physical inactivityLead (Pb) pollutionUrban outdoor air pollutionClimate changeChernobyl per month0.8 million prematuredeaths/year0.12 million prematuredeaths/year
Chinese Burden <strong>of</strong> Disease from Top 10 Risk FactorsPlus Selected Other Risk FactorsAlcoholBlood pressureTobaccoUnderweightOccupational hazards (5 kinds)Indoor smoke from solid fuelsOverweightRoad traffic accidents*Low fruit & vegetablesCholesterolUnsafe water/sanitationUrban outdoor air pollutionLead (Pb) pollutionPhysical inactivityUnsafe sex380,000Premature deaths per yearPneumonia in children: 21,000COPD in women: 342,000Lung cancer in women: 18.000252,000prematuredeaths per yearClimate change0% 1% 2% 3% 4% 5% 6% 7%Percent <strong>of</strong> <strong>of</strong> all All lost DALYs life in years 2000
Global Burden <strong>of</strong> Disease Database<strong>and</strong> Comparative Risk AssessmentWorld <strong>Health</strong> OrganizationBeing completely updatedFor 2011 releaseFor household air pollution:New exposure assessment modelingNew outcome estimates based on meta-analysesALRI, COPD, Lung CancerLow birth weight, cataracts, cardiovascular
ALRI/PneumoniaLow birthweightStillbirthDiseases <strong>for</strong> which we haveepidemiological studies - 2011COPDLung cancer(coal)Lung cancer(biomass)Blindness(cataracts, opacity)Heart diseaseBlood pressureST-segment<strong>The</strong>se additional diseases will be included in the2011 Comparative Risk AssessmentIn addition, using evidence from otherexposure sources, CVD will be included
Pollution <strong>and</strong> health effects <strong>of</strong> indoor fuelsmoke exposure in China*• Lung cancer• Respiratory illnesses• Lung function impairment• Immune system weakening• CO poisoning• Endemic arsenism <strong>and</strong> fluorosis*120+ publications from studies conducted in China
Coal stoves
Household Coal Use <strong>and</strong> Lung CancerChinese households using coalhave 2.27 times more lung cancerthan those using cleaner fuelsHosgood, et al., 2011
<strong>Health</strong> Benefits <strong>of</strong> Fuel/stove InterventionBest published studies in the world weredone by examining introduction <strong>of</strong> improvedcoal stoves in China
Improved Stoves Brought to XuanweiCounty in early 1980s• <strong>The</strong> reduction in particle levels was ~a factor <strong>of</strong>about three.• Reduction in lung cancer was ~40% in men <strong>and</strong>~45% in women. (Journal <strong>of</strong> the National CancerInstitute)• Reduction in COPD rates was also significant atabout 50% in both men <strong>and</strong> women (BritishMedical Journal)• Reduction in lung cancer <strong>and</strong> COPD took 10years to fully develop after IAQ improvement.
One <strong>of</strong> the few stoveinterventionstudies in theworld with a healthoutcome. A “naturalexperiment” – retrospectivestudy <strong>of</strong> COPDafter introduction <strong>of</strong>chimney stoves in a Yunnancounty in late 1970sCoal is the primary fuel inthese householdsChapman et al.BMJ, 2005
Why We Know Now that Chimneys are notEnoughTraditional open 3-stone 3fire:kitchen 48-hour PM 2.5 levels <strong>of</strong>600 - 1200 μg/m3Chimney wood stove, locally made<strong>and</strong> popular with households
TubitoTubito
Guatemala RCT: Kitchen ConcentrationsKitchen CO concentration (ppm)0.5 1 2 4 8 12(c)Control – open fireIntervention –Chimney StoveEffect <strong>of</strong>ChimneyStoveOnKitchen COLevelsFactor<strong>of</strong> ~10 less285 48-hmeasurementsSmith, et al,20100 5 10 15 20Months
Infant ExposuresChild CO exposure (ppm)0.5 1 2 3 4(a)ControlIntervention1888 48-hmeasurementsEffect <strong>of</strong>ChimneyStoveOnInfantExposures- 2x lessSmith, et al,20100 5 10 15 20Time relative to intervention (months)
(b )ention grouprol group(ppm)2 30.0 0.5 1.0 1.5100Childrenwithchimneystove~ 50% reductionin exposure onon averageChildrenwithopenfire120 240(ug/m3 PM 2.5 )-2 -1 0 1 2 3Child Average <strong>of</strong> Log <strong>of</strong> CO (ppm)Chimneystove didnot protectall children0.0 0.5 1.0 1.5-2 -1Predicted Long
Kitchens down by 10x, but children exposure down by only 2x, because--Time-activity: the kids do not spend their entire dayin the kitchen--Household (or “neighborhood”) pollution: a chimneydoes not reduce smoke, but just shifts it outside into thehousehold environment, where the difference betweenintervention <strong>and</strong> control households was less--No significant difference in bedrooms
Reduction in Kitchen 24-h PM 2.5 (ug/m 3 )300250200150-39% -34% -43% -40% -51% -41%101Amountreduced559883918610050161109~National St<strong>and</strong>ard128 122861210Langzhong YiLong Nanbu Enshi Yongshun All
20-month averageground-level PM2.5from satellite dataLarge areas <strong>of</strong> rural India<strong>and</strong> China have highambient air pollution –much from household fuel
Sources <strong>of</strong> Primary PM 2.5 : India <strong>and</strong> ChinaChafe, 2010
China: PM2.5 mass by province (2005)1200110010009008007006005004003002001000Source: GAINS-ChinaPM2.5 Emissions in China (2005)SHNDHEBEJINUHENAHUBESICHANHULIAOGUADHUNAGUAXHEILGUIZJILIZHEJYUNNJINXSHNXSHAANEMOCHONGANSXINGBEIJHAINSHANFUJITIANQINGNINXHONGTIBEChina Avgkt PM2.5Chafe, 2010; data from GAINS-China (2010) http://gains.iiasa.ac.atOtherHousehold Cooking
NASA INTEX_B DatabasePercent PM 2.5 emissions from households0%53%30%Percent <strong>of</strong> PM2.5emissions fromhouseholdsChafe, 2010; data from37NASA INTEX_B 2006
China Primary PM2.5 EmissionsPercent Anthropogenic PM2.550%45%40%35%30%25%20%15%10%5%Source: GAINS-China 2010Household CookingRoad Transport0%1990 1995 2000 2005 2010 2015 2020 2025 2030Percent <strong>of</strong> Total PM2.5 Primary EmissionsSource: GAINS-China (2010) http://gains.iiasa.ac.at
Controllable Global Warming from Black Carbon EmissionsNet <strong>of</strong> OC, Forcings from IPCC, 2007: 0.25 W/m 2Inventory from T Bond Database, V 7.1.1 Feb 2009Ag Waste4%Forest <strong>and</strong>Grassl<strong>and</strong>6%Power1%Ships <strong>and</strong> Aircraft2%~One-third <strong>of</strong> net black carbon <strong>and</strong>carbon monoxide emissions globallycome from household fuelsTransport24%Households36%~One-sixth <strong>of</strong> ozone causing pollutants~One-twentieth <strong>of</strong> methaneIndustry27%
Warming in 2005from emissionssince 1750A large part fromPIC: products <strong>of</strong>incompletecombustionIPCC, 2007
Climate Warming in 2020 Under Present TrendsHousehold BiomassUnger et al. 2010
Why we need really cleancombustion• Chimneys by themselves do nothing <strong>for</strong>outdoor air pollution or climate• We now know they do not help very muchwith health – only a factor <strong>of</strong> two reductionin exposure• This is not enough to either reach WHO orChinese st<strong>and</strong>ards• Or to obtain the health benefits needed
Heart Disease <strong>and</strong> <strong>Combustion</strong> Particle DosesHouseholdAir PollutionFrom “Mind the Gap,”Smith/Peel, 2010 <strong>and</strong> Popeet al., 2009
Heart Disease <strong>and</strong> <strong>Combustion</strong> Particle Doses35Heart Disease Impact302520151050HouseholdAir PollutionFrom “Mind the Gap,”Smith/Peel, 2010 <strong>and</strong> Popeet al., 20090 200 400 600 800 1000Annual mean PM2.5 - ug/m3
Where weWant toBe!MD-diagnosed Child PneumoniaOpen fireALRI Rate (per 100 Child-Yr)20 30 40 60 80(A)Chimney stove0 1 2 3 4 5 6 7Approximate Mean CO PM2.5 Exposure exposure (ppm) in 100s <strong>of</strong> ug/m3RESPIRE-Guatemala
After independence, China had specialconcerns <strong>for</strong> rural areas than werereflected in energy programs <strong>for</strong> decades• China led the world in rural energydevelopment in the 1970s <strong>and</strong> 80s• It introduced ~180 million improvedbiomass stoves, <strong>for</strong> example – one <strong>of</strong> thelargest rural development projects in worldhistory
China’s National Improved Stove Program (NISP)• More than 180 million improved stoves withchimneys were introduced from early 80s to mid 90s• Evaluation showed that NISP improved energyefficiency <strong>and</strong> IAQ in rural households, but notsufficiently to meet current Chinese air pollutionst<strong>and</strong>ards or WHO guidelines.• It focused on biomass; the rising coal use in ruralareas is threatening to erode the benefits unlessaction is taken soon. This is particularly a problemin the areas <strong>of</strong> “poisonous coals”.
Improved Stove in Shanxi
China’s National Improved Stove Program (NISP) 1981-1998300250China Statistical Yearbook, 2001200Frequency (MILLION)15010050Total RuralHouseholdsLu Y., 1993Smith et al.,1993Qiu et al.,1996MOE/DOE 1998CERS <strong>and</strong> CAREI 2000Total ImprovedStoves01975 1980 1985 1990 1995 2000 2005Year
New generation <strong>of</strong> Chinese stoves showlow particle emissions.But can they be reliably achieved in the field?How clean do they need to be?
Box model <strong>for</strong> Indoor PollutionCt = Concentration <strong>of</strong> pollutant (PM2.5 or CO) at time t(mg m-3)q = emission rate (mg min-1)α = nominal air exchange rate (ventilation rate) (min-1)V = kitchen volume (m3)t = time (min)Co = concentration from preceding time unit (mg m-3)f = fraction <strong>of</strong> emissions that enter kitchen(Note: time <strong>and</strong> emissions rates are a function <strong>of</strong>thermal efficiency, emission factor, stove power, <strong>and</strong>daily cooking energy needs.)
Top Per<strong>for</strong>mers in the Chinese National CookstoveCompetition – 2007CO/CO 2Nominal<strong>Combustion</strong>EfficiencyPM 10g/kgEfficiencygramsPM 10/MJdeliveredDaxu0.020(24%)**98.1% 0.28(13%)41.9%(3%) 0.037Luoyang*0.019(37%)98.1% 0.24(8%)35.2%(2%) 0.038Xintai*0.025(43%)97.6% 0.36(7%)32.6%(2%) 0.061Zhenghong0.019(19%)98.1% 0.24(22%)35.9%(4%) 0.037Mean 0.021 98.0% 0.28 36.4% 0.043
How clean does the stove have to be to meetthe WHO Guidelines to protect health?% meeting WHO Annual InterimTarget-1 PM 2.5(35 µg m -3 )50% 75% 90%g MJ-delivered -1 0.055 0.030 0.018Mean Concentration (µg m -3 ) 52 28 17Median Concentration (µg m -3 ) 35 19 11Mean per<strong>for</strong>mance <strong>of</strong> 4 top stoves in the Chinese NationalCookstove Contest was about 0.043 g/MJ-delivered.Thus, if the fraction <strong>of</strong> particles entering the house from stoveis less than 0.18/0.43 ~40%, 90% or more <strong>of</strong> households willmeet the WHO Air Quality Guideline
Conclusions: Intervention.• Reductions in exposures through simpleimprovements, such as chimney stoves, areintrinsically limited because smoke from the solidfuel is still around the household.• Future improvements should focus on stoves <strong>and</strong>fuels that reduce emissions, such as the biomassgasifier stoves being developed in the country.• Advanced combustion stoves can lower pollutionlevels substantially, with 90+% reductiondocumented• Substituting cleaner fuels <strong>for</strong> the poisonous coalsused in tens <strong>of</strong> millions <strong>of</strong> households should havean especially high priority.
Stove Use Monitors (SUMs) in ActionSUM s Temperature [C]807060504030201080706050403020100 2 4 6 8 10 12 14 16 18 20Days from initial use, Household #10 2 4 6 8 10 12 14 16 18 20Days from initial use, Household #220015010050020015010050Ruiz et al., submitted0Kitchen Carbon Monoxide [ppm]
100%80%60%100%40%20%0 2 4 6 8 101214161820Days from initial usePercent<strong>of</strong> totalStove-days32Percent stove-days80%60%40%20%3warmdrywarmrainycolddrywarmdrywarmrainycolddrywarmdrywarmrainyDec Feb Apr Jun Aug Oct Dec Feb Apr Jun Aug Oct Dec Feb Apr Jun Aug Oct100 2 4 6 8 10 12 14 16 18 20Days from initial useMealsperdayAverage daily meals210Initial adoptionwarmdrywarmrainycolddrywarmdrywarmrainycolddrywarmdrywarmrainyDec Feb Apr Jun Aug Oct Dec Feb Apr Jun Aug Oct Dec Feb Apr Jun Aug Oct2008 2009 2010Sustained useRuiz et al., submitted
Inter-instrument Comparison: 30 UCB-PATSUCB Particle <strong>and</strong> Temperature Monitoring System(custom PM monitor using smoke alarm technology)Lopez KitchenLa CienagaPlancha with chimney5 PM Sept 24 to 10 AM Sept 25, 2004.
UCB Particle MonitorHow many hours should we measure to obtaingood estimate <strong>of</strong> the long‐term mean?mg/m 3Kitchen PM 2.5 inhousehold using open cookfire
Long-term Household MeasurementsIntroduction<strong>of</strong> chimneystove
How Close to the True Mean With One Measurement?Alnes, etal, inprephours
<strong>The</strong> main reason household air pollutioncauses so much ill-health is<strong>The</strong> Intake Fractionis largeIF = 1.0IF is the fraction <strong>of</strong> material emittedthat is actually breathed in by someone
IF = 1.0
Intake Fractions : these are rough calculations <strong>for</strong> typicalexamples <strong>of</strong> sources in each classUS Coal Power PlantLDC Power PlantVehiclesNeighborhood SourcesStove Vented OutdoorsStove Vented IndoorsETSCigarette - mainstream0.1 1 10 100 1000 10000 100000 1000000Smith, 1993Grams Inhaled per Ton Emitted
<strong>Combustion</strong> Particles cause more health damagethan any other environmental contaminant• Worst thing to do is stick burning stuff in yourmouth ~5 million deaths globally• Not so great to have other people sticking intheir mouths nearby ~ 300k deaths• Bad even to have poorly burning stuff in yourcity ~ 1 million deaths• <strong>The</strong> oldest <strong>of</strong> burning practice, however --poorly combusted fuels in the home -- is still thecause <strong>of</strong> more ill-health than any other particlesource except smoking ~ 1.6 million deaths
Origins <strong>of</strong> the Chinese Rural Energy ProgramAt a biogas stove exhibit inWuhan on April 11, 1958,Mao Zhedong instructed,“This should be wellpromoted.”
Publications <strong>and</strong> presentations available at mywebsite. Just “google” Kirk R. SmithThank You