Rita Island Fishway: As Constructed Report - Wiki
Rita Island Fishway: As Constructed Report - Wiki
Rita Island Fishway: As Constructed Report - Wiki

Create successful ePaper yourself
Turn your PDF publications into a flip-book with our unique Google optimized e-Paper software.
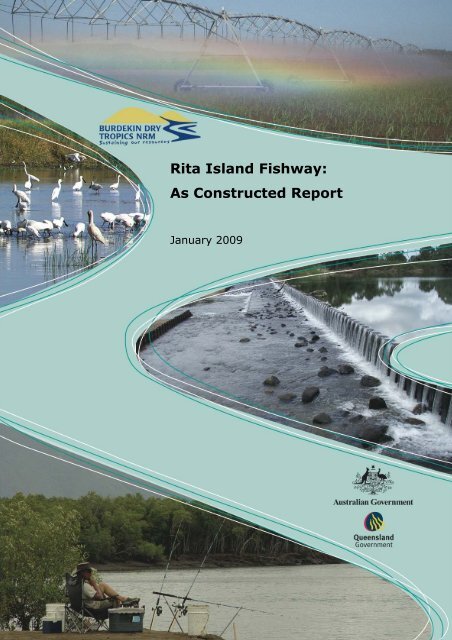
<strong>Rita</strong> <strong>Island</strong> <strong>Fishway</strong>:<strong>As</strong> <strong>Constructed</strong> <strong>Report</strong>January 2009
Published by Burdekin Solutions Ltd trading as Burdekin Dry Tropics NRMCopyright 2008 Burdekin Solutions LtdISBN 978-1-921584-13-8The copyright Act 1968 permits fair dealing for study research, news reporting, criticismor review. Selected passages, tables or diagrams may be reproduced for such purposesprovided acknowledgement of the source is included. Major extracts of the entiredocumentmay not be reproduced by any process without the written permission of the ChiefExecutive Officer, Burdekin Dry Tropics NRM.Please Cite as : Sunner L, Carter J, Lucas R. 2008. <strong>Rita</strong> <strong>Island</strong> <strong>Fishway</strong>-<strong>As</strong> <strong>Constructed</strong><strong>Report</strong>. Burdekin Solutions Ltd, Townsville. 23 pp.Further copies may be obtained from Burdekin Dry Tropics NRM or from ourWebsite: www.bdtnrm.org.auCnr McIlwraith and Dean Sts,Townsville, Q 4810P.O Box 1466, Townsville Q 4810Ph: (07) 47243 544 Fax: (07) 47243 577
Document historyL:\Projects\2007\P207040_BDTNRM_Fish_Barriers_Remediation\2_Design\<strong>Rita</strong><strong>Island</strong>\P207040_R02_V1_<strong>Rita</strong>_<strong>Island</strong>_<strong>Fishway</strong>_<strong>As</strong>_<strong>Constructed</strong>_<strong>Report</strong>.docREVISIONISSUE DATE VERSION NO. AUTHOR(S) CHECKED APPROVED09/01/2008 V01.1 Luke SunnerJason CarterRohan LucasJason CarterRohan Lucas(RPEQ)DISTRIBUTIONVERSION NO. ISSUED TO DESCRIPTIONV01.1 Tim MarsdenDiana O’DonnellAndrew KellyDPI&FBDTNRMNBWBACKNOWLEDGEMENTS<strong>Report</strong>ingThis report is supplementary to the report “<strong>Rita</strong> <strong>Island</strong> <strong>Fishway</strong> – Detailed Design” (December2008), prepared by Alluvium Consulting (Queensland). It is part of the Burdekin Dry TropicsNatural Resource Management (BDTNRM) Fish Passage Project and is one of a series of reportsproduced for that project.Readers are referred to the above mentioned report for further background reference.The fishway design concept was developed by (DPI&F) from discussions in the field primarilybetween Tim Marsden (DPI&F) and Jason Carter (Alluvium Consulting) with input from RohanLucas (Alluvium Consulting) and Ross Kapitzke (JCU School of Engineering).The Detailed Design <strong>Report</strong> fully acknowledges the preceding work of DPI&F as the basis for thedesign through the above mentioned discussions and reports.ResourcesThe project has been developed cooperatively between North Burdekin Water Board, BurdekinDry Tropics NRM and OceanWatch Australia Ltd - Tide to Table – Burdekin Dry Tropics. Theauthors acknowledge the support and contribution of the following:• North Burdekin Water Board and staff, in particular, Andrew Kelly and Dave Brooks.• BDTNRM and OceanWatch Tide to Table Program for funding the design, constructionmaterials and construction supervision of the <strong>Fishway</strong>.<strong>As</strong> <strong>Constructed</strong> <strong>Report</strong>:<strong>Rita</strong> <strong>Island</strong> Sand Dam <strong>Fishway</strong>Page i
ContentsDocument historyContentsList of tablesList of figuresiiiiiii1 Introduction 32 <strong>Fishway</strong> Construction <strong>As</strong>sessment 33 Summary and Recommendations for Management 84 References 10Appendix A <strong>Fishway</strong> Construction Photos 11List of tablesTable 1 - Predicted high tide heights for Townsville (BoM(a), 2009) 6List of figuresFigure 1 – <strong>Constructed</strong> alterations to fishway design 4Figure 2 - Delivered quarry rock (10/12/2008) 12Figure 3 - Placement of rock rip-rap protection adjacent fishway entrance channel (10/12/2008) 12Figure 4 - Placement of rock rip-rap protection adjacent fishway entrance channel (11/12/2008) 13Figure 5 - Excavation of fishway cut off wall (11/12/2008) 13Figure 6 - Placement of fishway cut off wall geotextile and rock (11/12/2008) 14Figure 7 - Placement of fishway cut off wall geotextile and rock (11/12/2008) 14Figure 8 - Excavation of fishway (11/12/2008) 15Figure 9 - Excavation of fishway (11/12/2008) 15Figure 10 - Placement of ridge rocks (12/12/2008) 16Figure 11 - Placement of ridge rocks (12/12/2008) 16Figure 12 - Placement of ridge rocks (12/12/2008) 17Figure 13 – Completed fishway (17/12/2008) 17<strong>As</strong> <strong>Constructed</strong> <strong>Report</strong>:<strong>Rita</strong> <strong>Island</strong> Sand Dam <strong>Fishway</strong>Page ii
1 IntroductionThis report provides details of the construction process, the final constructed form and variationsto the Detailed Design that were required as a result of working conditions on site duringconstruction of the <strong>Rita</strong> <strong>Island</strong> sand dam fishway, which was undertaken in December 2008.Construction work was under taken by NBWB, with construction supervision by DPI&F to ensurethat the fishway performs as intended to assist fish movement and with engineeringoverview/supervision by Alluvium.The fishway:i. Creates a series of pools or “cells” with dividing ridge lines of large rock to enable fish tomove through up a series of 100mm drops.ii.Provides localised protection from erosion by dissipating energy as flows move throughand from the fishway to the channel downstream of the fishway.Because of the site conditions some additional erosion protection works to protect the channelbank and limit overbank flows were also implemented.2 <strong>Fishway</strong> Construction <strong>As</strong>sessmentThere were four main tasks as part of the construction process described in the detailed design:1. Modification of the inflow channel to ensure sufficient water can be delivered to thefishway for it to perform as intended.2. Construction of the fishway including entrance channel3. Rock riprap protection of the channel banks adjacent to the fishway entrance channel.4. Rock or earth bank adjacent to the fishway crest (fishway exit) to guide low flows into thefishway.A selection of photos taken of the construction process is presented in Appendix A.Task 3 was completed as per the detailed design.Task 2 was constructed as per the detailed design with only minor modifications.Tasks 1 and 4 as constructed differed from the detailed design due to the following:Bypass flowsTask 4 in the detailed design provided for a cutoff wall and rock or earth bank across thefloodplain between the fishway and the sand dam. The purpose of this was to guide low flows intothe fishway and prevent the fishway from being outflanked except when flows exceeded designcapacity. However, at the time of construction the floodplain was too saturated to enablemachinery to operate in the area identified for location of the cutoff wall and rockwall/earth bank.This required an alteration of the design to retain the cutoff wall across the full width of the fishwaycrest and keying into the banks either side by approximately 5 metres on the right hand bank and15 metres on the left hand bank (see Figure 1). The extension of the cutoff wall (which was tohave been built up to include a rock or earth bank across the floodplain to the sand dam) was notconstructed.An alternative construction arrangement was implemented instead. This consisted of constructinga rock spillway in the bank as part of the bank protection works (see Figure 1). The rock spillway<strong>As</strong> <strong>Constructed</strong> <strong>Report</strong>:<strong>Rita</strong> <strong>Island</strong> Sand Dam <strong>Fishway</strong>Page 3
crest was set at 100mm higher than the crest of the fishway to ensure that the fishway transfersflows preferentially and that the spillway only operates once the fishway flow approaches capacity.Once the capacity of the fishway and spillway are exceeded it is intended that the sand dam/swould breach or be breached by NBWB to ensure that high flows exceeding the design capacity ofthe fishway and spillway are not exceeded for anything other than a short period.BypassspillwayAdditional rockbeachingExtent of cutoff wallFigure 1 – <strong>Constructed</strong> alterations to fishway design<strong>As</strong> <strong>Constructed</strong> <strong>Report</strong>:<strong>Rita</strong> <strong>Island</strong> Sand Dam <strong>Fishway</strong>Page 4
Tidal influenceTask 1 was not undertaken as per the detailed design and the crest of the fishway was raised byapproximately 200mm compared to the detailed design. This was due to onsite observations oftidal influence on flows.Water levels at the location of the fishway on the Anabranch are tidally influenced. Onsitediscussions between the designers and NBWB staff did not initially identify that tidal range couldon occasion be sufficiently great to drown out the fishway and potentially result in inflow into thepool behind the sand dams. When this was identified as a possible problem the design team andNBWB staff discussed the preferred approach to managing the design and subsequent operationof the fishway to minimise the risk of saltwater inflow into the pool.The identified solution was to raise the crest level of the fishway approximately 200mm to matchthe existing land surface so that the fishway would not increase the risk of saltwater intrusion butrather maintain the existing situation. The modification of the inflow channel to ensure sufficientwater can be delivered to the fishway for it to perform as intended was not undertaken at the timeof construction. A reduced capacity of the fishway was deemed acceptable whilst notcompromising its ability to assist fish to move from the downstream channel into the pool abovethe sand dam/s.It is however, recommended that NBWB staff observe the performance of the channel upstreamform the crest of the fishway over at least the coming year to ascertain if flows are sufficiently freemoving to allow fish to move through. The biggest potential issue is weed growth, which maydevelop too densely to allow fish movement, in which case weed control would be required.An adaptive management approach is required to maintain and manage as needed.In regard to the level of risk of tidal inundation of the fishway and saltwater intrusion a number ofactions have been undertaken and/or are recommended as follows:Australian Height DatumIn 1971 the mean sea level for 1966-1968 was assigned the value of zero on the Australian HeightDatum at thirty tide gauges around the coast of the Australian continent. The resulting datumsurface, with minor modifications in two metropolitan areas, has been termed the AustralianHeight Datum (AHD) and was adopted by the National Mapping Council as the datum to which allvertical control for mapping is to be referred. Elevations quoted using this datum are normallyfollowed with the acronym (AHD) (Geoscience Australia, 2009). Seehttp://www.ga.gov.au/nmd/geodesy/datums/ahd.jsp for further information.High tide levels and ground surface levels at the fishwayDuring construction, DPI&F supervision staff marked the height of the highest level of the high tideon Thursday 11 th December 2008. This was subsequently surveyed by survey company BrazierMotti and all survey levels from previous survey work and the fishway cells was then provided inAustralian Height Datum (AHD).• High Tide at the fishway = 1.486m AHD this correlates to a predicted high tide height of3.58 metres on Thursday 11 th December 2008.• <strong>Fishway</strong> first cell crest = 1.108 to 1.298m AHD• <strong>Fishway</strong> top cell crest = 1.377 to 1.548m AHD• The inflow channel has a highest point of approximately 1.6m AHD.A high tide of approximately 3.7m (1.6m AHD) would be level with the bed of the inflow channel atits highest point and fully drown out the fishway.<strong>As</strong> <strong>Constructed</strong> <strong>Report</strong>:<strong>Rita</strong> <strong>Island</strong> Sand Dam <strong>Fishway</strong>Page 5
Implications for the management of the fishway and saltwater intrusionWhen the sand dams are in place there is a risk that high tides greater than approximately 3.7m(1.6m AHD) as predicted by the Bureau of Meteorology (BoM) (seehttp://www.bom.gov.au/oceanography/tides/MAPS/townsville.shtml#form) could result in inflow tothe pool above the sand dams via the low point in the area of the fishway. This does notnecessarily mean that this would be salt water intrusion as the outflow of freshwater from the poolthrough the fishway would create a freshwater buffer between the saltwater and the fresh. Neverthe-lessit would be a wise precaution to consider the implications and develop a managementstrategy to deal with this.It is considered to be a low risk that high tides up to 3.7m (approximately 1.6 AHD) would poseany significant problems. A high tide of that height would only be that high for a very short periodand would pose limited risk. <strong>As</strong> tides increase above 3.7m the period of high tide above that heightis extended and the risk increases. To determine how often such tides occur the following tableidentifies the dates and tide heights over 3.7m for the next two years.Table 1 - Predicted high tide heights for Townsville (BoM(a), 2009)2009 HighTideHeight(m)Time 2010 HighTideHeight(m)TimeFriday, 9 January 2009 3.75 0756 Friday, 1 January 2010 3.89 0931Saturday, 10 January2009 3.95 0837Saturday, 2 January2010 3.88 1015Sunday, 11 January 2009 4.05 0919 Sunday, 3 January 2010 3.76 1101Monday, 12 January2009 4.01 1002Thursday, 28 January2010 3.79 0756Tuesday, 13 January2009 3.84 1045 Friday, 29 January 2010 4.00 0832Saturday, 7 February2009 3.87 0745Sunday, 8 February 2009 4.04 0821Monday, 9 February2009 4.10 0859Tuesday, 10 February2009 4.02 0935Wednesday, 11 February2009 3.80 1012Sunday, 8 March 2009 3.86 0725Saturday, 30 January2010 4.11 0912Sunday, 31 January2010 4.07 0951Monday, 1 February2010 3.88 1031Friday, 26 February2010 3.89 0734Saturday, 27 February2010 4.07 0808Sunday, 28 February2010 4.11 0845Monday, 9 March 2009 3.95 0758 Monday, 1 March 2010 4.00 0921Tuesday, 10 March 2009 3.93 0830 Tuesday, 2 March 2010 3.73 0959<strong>As</strong> <strong>Constructed</strong> <strong>Report</strong>:<strong>Rita</strong> <strong>Island</strong> Sand Dam <strong>Fishway</strong>Page 6
2009 HighTideHeight(m)Time 2010 HighTideHeight(m)TimeWednesday, 11 March2009 3.79 0903Saturday, 27 March2010 3.81 0706Monday, 22 June 2009 3.80 2112 Sunday, 28 March 2010 3.89 0739Tuesday, 23 June 2009 3.86 2158 Monday, 29 March 2010 3.84 0814Wednesday, 24 June2009 3.80 2245 Sunday, 11 July 2010 3.73 2113Monday, 20 July 2009 3.76 2017 Monday, 12 July 2010 3.80 2153Tuesday, 21 July 2009 3.92 2058 Tuesday, 13 July 2010 3.74 2235Wednesday, 22 July2009 3.97 2139 Sunday, 8 August 2010 3.72 2013Thursday, 23 July 2009 3.86 2220 Monday, 9 August 2010 3.87 2049Tuesday, 18 August 2009 3.82 1959Wednesday, 19 August2009 3.93 2035Thursday, 20 August2009 3.91 2112Friday, 21 August 2009 3.73 2149Wednesday, 16September 2009 3.74 1932Tuesday, 10 August2010 3.90 2127Wednesday, 11 August2010 3.77 2206Monday, 6 September2010 3.76 1945Tuesday, 7 September2010 3.85 2019Wednesday, 8September 2010 3.80 2056Thursday, 17 September2009 3.76 2006Thursday, 31 December2009 3.78 0848# Tides over 3.8m are highlighted in yellow<strong>As</strong> can be seen a tide height of more than 3.7m occurs on 54 days from 9 January 2009 to 31December 2010 whilst tides greater than 3.8m occur on 39 days during the same period. Of thosedays it is only when the sand dams are in place that management measures need to beconsidered. At times when the sand dams have been breached during high flows additionalmanagement is not relevant as the tides rise and fall under natural conditions.Tides up to 3.8 are considered to pose a low risk of any saltwater intrusion or, if they do, for a verylimited time as the peak of the tide is for a short duration. This will need to be checked on site atsuch times to compare expected events to actual events. It should take few site inspections at thepeak high tides to determine whether or not there is any real risk.It is therefore recommended that NBWB monitors tide heights and possible salt water intrusion atthe fishway when the sand dams are in place to determine when or if management may be<strong>As</strong> <strong>Constructed</strong> <strong>Report</strong>:<strong>Rita</strong> <strong>Island</strong> Sand Dam <strong>Fishway</strong>Page 7
equired. If required, the recommended management option is to temporarily extend the sand dambetween the sand dam and the channel bank (either above or at the fishway crest or at thefishway entrance, which ever is more practical to add and remove) to prevent salt water intrusionif, through observation, it is identified as a risk. During construction of the fishway a stockpile ofsand was left for such an eventuality.Cautionary Note (BoM(b), 2009)Users of standard port tide tables should be aware that the heights and stream velocities arepredictions that are prepared for average meteorological conditions and seasonal variations.Tidal predictions for secondary ports are often based on limited observations. They areprepared by applying an adjustment to the time and height of tide in the appropriate standardport tide table. There are a number of adjustment procedures each of which is based on thestatistical correlation between the tidal times and heights at the standard and secondary port.The correlation is never perfect. Accordingly the user must expect that the tidal predictions forthe secondary port will be less accurate than those for the related standard port.The actual water level height and stream velocity at both standard and secondary ports mayvary when the meteorological conditions depart from the average.Variations in tidal heights are mainly caused by unusually high or low barometric pressure(which includes cyclonic storm surges) or by prolonged strong winds.Low-pressure systems tend to raise sea levels and high-pressure systems tend to lowerthem. The water does not, however, adjust itself immediately to a change of pressure. Itresponds, rather, to the average change in pressure over a considerable area.The effect of wind on sea level and therefore on tidal heights and times is variable anddepends on the geography/topography of the area in question. In general wind will raise thesea level in the direction towards which it is blowing.A strong onshore wind will "pile up" the water and will cause the high waters to be higher thanpredicted. Winds blowing off the land will have the opposite effect.3 Summary and Recommendations for Management<strong>As</strong>sessment of the recently constructed fishway at <strong>Rita</strong> <strong>Island</strong> shows the fishway meets the designintent and apart from the necessary modifications identified during construction and documentedin Section 2, is generally in accordance with <strong>Rita</strong> <strong>Island</strong> <strong>Fishway</strong>: Detailed Design (Sunner et al2008).Recommended management itemsTo ensure the fishway continues to operate successfully in conjunction with the sand dams anumber of management practices will be required:• Periodic checks of all rock works should be carried out to allow early identification of anyinstabilities.• Periodic grazing of the inlet channel (above fishway crest) should be undertaken toreduce weeds and ensure vegetation does not become too dense for fish passage.• Prior to the capacity of the fishway and bypass spillway being exceeded by flows, NBWBmanagement operations should breach the sand dam as is the usual operational practicefor the sand dam in high flow events.• During the periods when the sand dams are in place NBWB should monitor tide heightsand possible saltwater intrusion via the fishway. The recommended management option<strong>As</strong> <strong>Constructed</strong> <strong>Report</strong>:<strong>Rita</strong> <strong>Island</strong> Sand Dam <strong>Fishway</strong>Page 8
is to temporarily extend the sand dam between the sand dam and the channel bank(either above or at the fishway crest or at the fishway entrance, which ever is morepractical to add and remove) to prevent salt water intrusion if, through observation, it isidentified as a risk. Further information is presented in Section 2.<strong>As</strong> <strong>Constructed</strong> <strong>Report</strong>:<strong>Rita</strong> <strong>Island</strong> Sand Dam <strong>Fishway</strong>Page 9
4 ReferencesAlluvium (2008) <strong>Rita</strong> <strong>Island</strong> <strong>Fishway</strong> – Detailed DesignBoM(a) (2009), Commonwealth of Australia, Tide Predictions for Queensland, viewed 13 January2008, http://www.bom.gov.au/oceanography/tides/MAPS/nqld.shtml#mapBoM(b) (2009), Commonwealth of Australia, viewed 9 January 2008,http://www.bom.gov.au/oceanography/tides/met_effects.shtml#windDepartment of Primary Industries and Fisheries (2008). BDTNRM Fish Passage RehabilitationProgram, <strong>Rita</strong> <strong>Island</strong>: Concept <strong>Fishway</strong> <strong>Report</strong>. Queensland Government.<strong>As</strong> <strong>Constructed</strong> <strong>Report</strong>:<strong>Rita</strong> <strong>Island</strong> Sand Dam <strong>Fishway</strong>Page 10
Appendix A <strong>Fishway</strong> Construction Photos<strong>As</strong> <strong>Constructed</strong> <strong>Report</strong>:<strong>Rita</strong> <strong>Island</strong> Sand Dam <strong>Fishway</strong>Page 11
Figure 2 - Delivered quarry rock (10/12/2008)Figure 3 - Placement of rock rip-rap protection adjacent fishway entrance channel(10/12/2008)<strong>As</strong> <strong>Constructed</strong> <strong>Report</strong>:<strong>Rita</strong> <strong>Island</strong> Sand Dam <strong>Fishway</strong>Page 12
Figure 4 - Placement of rock rip-rap protection adjacent fishway entrance channel(11/12/2008)Figure 5 - Excavation of fishway cut off wall (11/12/2008)<strong>As</strong> <strong>Constructed</strong> <strong>Report</strong>:<strong>Rita</strong> <strong>Island</strong> Sand Dam <strong>Fishway</strong>Page 13
Figure 6 - Placement of fishway cut off wall geotextile and rock (11/12/2008)Figure 7 - Placement of fishway cut off wall geotextile and rock (11/12/2008)<strong>As</strong> <strong>Constructed</strong> <strong>Report</strong>:<strong>Rita</strong> <strong>Island</strong> Sand Dam <strong>Fishway</strong>Page 14
Figure 8 - Excavation of fishway (11/12/2008)Figure 9 - Excavation of fishway (11/12/2008)<strong>As</strong> <strong>Constructed</strong> <strong>Report</strong>:<strong>Rita</strong> <strong>Island</strong> Sand Dam <strong>Fishway</strong>Page 15
Figure 10 - Placement of ridge rocks (12/12/2008)Figure 11 - Placement of ridge rocks (12/12/2008)<strong>As</strong> <strong>Constructed</strong> <strong>Report</strong>:<strong>Rita</strong> <strong>Island</strong> Sand Dam <strong>Fishway</strong>Page 16
Figure 12 - Placement of ridge rocks (12/12/2008)Figure 13 – Completed fishway (17/12/2008)<strong>As</strong> <strong>Constructed</strong> <strong>Report</strong>:<strong>Rita</strong> <strong>Island</strong> Sand Dam <strong>Fishway</strong>Page 17
<strong>As</strong> <strong>Constructed</strong> <strong>Report</strong>:<strong>Rita</strong> <strong>Island</strong> Sand Dam <strong>Fishway</strong>Page 18