Demography Paper
Demography Paper
Demography Paper

You also want an ePaper? Increase the reach of your titles
YUMPU automatically turns print PDFs into web optimized ePapers that Google loves.
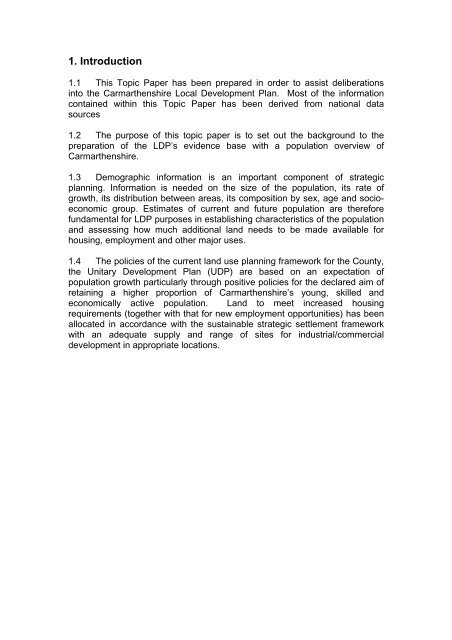
FIG 2: PERCENTAGE POPULATION CHANGE BY AGE GROUP: 2001-20062520151050-5-10-15-200-4 5-910-1415-1920-2425-2930-3435-3940-44% change-2.37 -14.7 2.18 8.03 -2.53 -2.86 -14 -4.66 9.2 4.99 -7.53 13.7 22.2 8.44 0.34 -6.47 13.4 9.6745-4950-5455-5960-6465-6970-7475-7980-84 85+Source: ONS4.3 When further analysis is undertaken of age groups exhibiting the mostsignificant percentage changes, the results are quite revealing:• Aged 5-9 years declined from 10,760 to 9,980.• Aged 30-34 years declined from 10,630 to 9,140.• Aged 55-59 years increased from 11,800 to 13,460.• Aged 60-64 years increased from 9,930 to 12,130.• Aged 80-84 years increased from 4,990 to 5,660The County’s population in line with national trends is exhibiting anincreasingly elderly population.ii. Gender Profile4.4 Table 1 illustrates the gender split during the period 2001 to 2006. It is evidentthat the number of females within the County remains at a higher level than thenumber of males.
TABLE 1 : POPULATION BY GENDER : CARMARTHENSHIRE 2001-2006Females Males Total2001 90,100 83,500 173,6002002 90,500 84,100 174,6002003 90,700 84,600 175,4002004 91,300 85,400 176,7002005 91,500 85,700 177,1002006 91,900 86,100 178,000Source: ONSNote: Figures may not add up due to rounding.4.5 The above table reveals that the number of males within the Countyremains at approximately 7.5% lower than the number of females consistentlythroughout the period 2001-2006. During the period 2001 to 2006, thepercentage of males/females as a proportion of the total population has, in themain, stayed around the same level. However, Figure 4 below illustrates aslight shift, with the percentage of males slightly increasing and number offemales slightly decreasing.FIG 4: % POPULATION BY GENDER 2001-2006200648.451.6200548.451.62004200348.348.251.751.7MalesFemales200248.151.8200148.151.846 47 48 49 50 51 52 53iii. Components of Population Change4.6 There are two key components to population change, natural increaseor decrease and net migration. Natural change is essentially the pattern of livebirths and deaths, whilst migration is the most volatile of all the components,and is very difficult to estimate with any degree of accuracy.
5. Births5.1 There were 1,668 live births to mothers living in Carmarthenshireduring 2001, which increased to 1,887 in 2006. However, the trend does notshow a consistent rise, as is illustrated by Fig 5 the number of births increasedsteadily between 2001 and 2004, only to decrease by 4% in 2005, and restorethe consistent pattern of growth in 2006.FIG 5: LIVE BIRTHS: CARMARTHENSHIRE 2001-20061950190018871850181518001750172417671744170016681650160015502001 2002 2003 2004 2005 20065.2 This increase of 13.1% in births is greater than the Wales averageincrease of 9.8%, and is higher than the changes for Ceredigion,Pembrokeshire and Swansea. At 2006 the General Fertility Rate for all agesof mother in the County stood at 58.9, only slightly above the Wales average.5.3 The highest number of live births in 2001 and 2006 were to motherswithin the 25-29 age category, with the intermediate years showing a higherproportion within the 30-34 age group. The number of live births to motherswithin the 35 to 39 and 40 and over categories has also increased during theperiod 2001 to 2006.6. Deaths6.1 The number of deaths registered in Carmarthenshire in 2006 was2,190, 5.45% lower than the figure recorded in 2001, despite a rise in theelderly population within the County. Life expectancy at birth inCarmarthenshire in 2006 for males(75.8 years) falls short of the Wales figureof 76.6 years ,whilst the female level (81.1 years) is slightly above the Walesfigure of 81 years.
FIG 6: REGISTERED DEATHS: CARMARTHENSHIRE 2001 – 2006250024502400235023002250220021502100205020002001 2002 2003 2004 2005 20067. Migration7.1 According to the mid year estimates produced by the Office for NationalStatistics (ONS), Carmarthenshire’s population increased from 176,400 in2004 to 178,000 by mid 2006. With the number of deaths surpassing thenumber of births by around 300-500 per annum in Carmarthenshire between2004-2006, net migration is, therefore, a key component of population changein the County, accounting for an approximate increase of 900 to 1200 in theCounty’s population over the same time period.7.2 Migration between local authorities in Wales and with the rest of theUnited Kingdom shows that the County has been receiving a net inflow ofmigrants each year since 2001.TABLE 2 : INTERNAL MIGRATION : CARMARTHENSHIRE: 2001-2005Thousands2000-20012001-20022002-2003YearInflow Outflow Inflow Outflow Inflow Outflow Inflow Outflow Inflow OutflowAllAges 6.5 5.3 6.7 5.1 6.8 4.6 6.6 4.6 6 4.80-15 1.3 0.8 1.4 0.8 1.4 0.7 1.3 0.7 1.1 0.816-24 1.2 1.6 1 1.6 1.1 1.4 1.1 1.4 1.1 1.425-44 2.1 1.7 2.1 1.6 2.2 1.5 2.1 1.5 2.1 1.645-64 1.3 0.7 1.4 0.7 1.6 0.7 1.5 0.7 1.3 0.765+ 0.6 0.4 0.7 0.3 0.6 0.3 0.7 0.3 0.5 0.42003-20042004-2005Source: Statswales
7.3 The difference between inflow and outflow in 2000/2001 was +1200,which was the same amount as in 2004/05. The greatest difference betweeninflow and outflow was witnessed in 2002/03 with a net inflow of 2,200. Onage group basis the 25 to 44 age category witnesses the greatest amount ofboth inflow and outflow in Carmarthenshire, with a broadly consistent level offlows between 2001-2005.7.4 These flows are internal flows within the UK however internationalmigration has become a major factor in population change in recent years,with the issue of international migration rapidly developing into an integralcomponent in the formation of population estimates on a national, regionaland local level. It is widely believed that migration, on a national level, hasbeen underestimated in the past and has been understated in officialpopulation estimates for local areas.8. Changes within the County8.1 There is very little information available on population change within theCounty post the 2001 Census, although ONS have produced ExperimentalPopulation Estimates for Census Area Statistics (CAS) Wards in England andWales. These figures are consistent with the published local authoritypopulation estimates but although the estimates are produced down to unitlevel, these are estimates with limitations because of the administrative datasources used to produce them.
8.2 At the County level there is evidence of a 2.5% increase in populationbetween 2001-2005, with a number of wards exhibiting estimated populationincreases above this level. Wards including Saron, Bynea, Pembrey, Cenarthand Whitland are estimated to have increased their population in percentageterms, from 7.1% in Whitland to 9.4% in Saron.9. Migrant Workers9.1 According to the Workers Registration Scheme, Carmarthenshire hasseen 3250 migrant workers enter the County during the period May 2004 toDecember 2007. There have been approximately 8% more migrant workersentering the area between April 2006 and December 2007 than between May2004 and March 2006. The majority of the migrant workers who havemigrated to Carmarthenshire since 2006 have stipulated their intended lengthof stay to be over 2 years; this was not the case in the two years previous,with the majority specifying an intended stay of less than 3 months during May2004 to March 2006.FIG 7: WORKERS REGISTRATION SCHEME – INTENDED LENGTH OFSTAY MAY 2004 TO DECEMBER 2007180016001400120010008006004002000May 04- Mar06Apr 06- Jun 06Jul 06 -Sep 06Oct 06 - Jan 07 -Dec 06 Mar 07Apr 07- Jun 07Jul 07 - Oct 07 -Sep 07 Dec 07>3 months3-5 months6-11 months1-2 years2+ yearsDo not knowTotalSource: Workers Registration Scheme9.2 However, there is insufficient and incomplete data available on aregional and national level with regards to the numbers of migrant workers inCarmarthenshire to give a true reflection. Data on migrant workers and theirfamilies is weak despite the availability of sources of data such as theWorkers Registration Scheme for A8 countries which therefore makes futureplanning problematic.
10. Household Trends10.1 The issue of housing is a critical element for future planning purposes.The 2001 Census recorded that there were 73,112 households withinCarmarthenshire, which equated to an average household size of 2.32.According to the Mid-Year Household Estimates for Wales, the averagehousehold size in Carmarthenshire has fallen from 2.39 in 1996 to 2.3 in2004. The annual decrease has been steady at around 0.46%.10.2 The rise in the number of houses and fall in average household size isa continuation of a long-term national and local trend which can be attributedto certain factors such as the fall in the number of births, a decline in theaverage number of children per family and a higher instance of single peopleliving alone.10.3 Fig 8 illustrates that Carmarthenshire’s housing stock has continued torise during the period 1996 to 2007. It is evident that from 2004, there hasbeen a far greater rise in numbers when compared to the steady increasebetween 1996 and 2004; housing stock numbers increased by 2749 between1996 and 2004 and by 3674 between 2004 and 2007, a percentage increaseof 33%.FIG 8: DWELLING STOCK: CARMARTHENSHIRE 1996 - 2007820008000078000760007400072000700001996 1997 1998 1999 2000 2001 2002 2003 2004 2005 2006 2007Source: Welsh Assembly Government/Local Government Data Unit
12. Population Projections - Wales12.1 Population projections are estimates of the population in future years.These projections are based on assumptions with regards to fertility rates, lifeexpectancy and migration, therefore, population projections indicate thepotential population should all such assumptions be realised.12.2 The Office for National Statistics has produced a principal nationalpopulation projection for Wales based on 2006 and projects population up to2031. Key results are as follows:• By 2031, it is expected that the population of Wales will increase by 11%,reaching a total of 3.3 million.• The percentage of children in Wales currently represent approximately 19%of the total population, however, this will fall to 17% by 2031. Conversely,pensioners currently represent 21% of the total population and this will riseto over 24% by 2031.• The number of people within the working age category will increase to 8%by 2031.• As is the case with Carmarthenshire, the Welsh population will become olderwith the median age increasing from 40.6 in 2006 to 44.3 in 2031.Fertility12.3 Analysing past trends, the number of women who were of child bearingage decreased from 592,000 in 1991, to 569,000 in 1999. This figure has,however, increased to 579,000 in mid-2006. During 2008-2019, the number ofwomen of child bearing age is expected to fall from 580,000 to 550,000,before increasing to 560,000 by 2027.Life Expectancy12.4 By mid-2031, life expectancy is expected to increase to 82.4 for malesand 85.9 for females. This assumption is based on the presumption that theannual rates of mortality improvement will converge to a common rate of 1.0per cent a year at 2031 for most ages.Birth and Death Rates12.5 Examining birth and death rates during the late 1990’s and early2000’s, the number of deaths has been consistently higher than the number ofbirths. Conversely, mid 2005 to mid 2006 witnessed a transposition of thistrend, with birth rates exceeding death rates by 1900. Over the coming years,births are expected to continue to increase before remaining at around 35,000during 2009-2019. The period up until 2031 will then see a decrease in thebirth rate to around 33,000. Over the next 4 years, the death rate in Wales isprojected to decrease to some extent before stabilising at around 30,000between 2012 and 2021. It is then expected that the number of deaths willgradually increase to 34,000 by 2031.
Migration12.6 The inflow and outflow of migrants into Wales on an annual basis canmake it extremely difficult to project future trends. The increase in populationin Wales over the last two has been increasingly affected by net migrationfrom the rest of the UK and abroad. In the 2006-based national populationprojections, the long-term (from 2012 onwards) assumption for net migrationis +9,500. This includes a +7,500 long-term cross-border (within UK) netmigration assumption and a +2,000 long-term international net migrationassumption. The long-term migration assumption for the 2004-basedprojections was +11,500.12.7 For the first twenty years of the projected time period, natural change isexpected to be positive with an approximately equal number of births anddeaths from 2026 to 2031. The change in total population is projected to behigh with in the region of a 70,000 to 75,000 increase for each five year periodduring the first fifteen years of the projected time period. It is expected todecrease to around 47,000 during the 2026-2031 period.Age Groups12.8 It is evident from the projections that as the age structure of Wales willchange of the projected time period, the number of dependent people, bothchildren and people of pensionable age, will increase.12.9 In 2006, there were approximately 310 children per 1000 people ofworking age and this is expected to remain fairly constant, with around 290 to300 children per 1000 people by 2031. In 2006, there were also 340 people ofpensionable age per 1000 people of working age, and this figure is likely toincrease to 420 by 2031.12.10 During the period between 1971 and 2006, the number of dependentsper 1000 people decreased; although the number of people of pensionableage increased during this time period, the number of children decreased,therefore leading to an overall decrease in dependents. Between 1971 1and2006, the number of dependents fell from 732 to 657, however, by 2031, thisnumber is projected to increase to 710.Carmarthenshire Population Projections12.11 The Assembly are in the process of producing sub national projectionsfor Unitary Authorities in Wales based on a "bottom up" approach rather thanusing the Wales projections as a control total for UA's. It is understood therewill be a principal projection based of past trends and some variant projectionswill also be produced such as natural change projections. The Assembly willbe using Popgroup a family of software developed to forecast population,households and the labour force for areas and social groups. It is based onExcel to build on users' existing spreadsheet skills. The software has beenused to forecast national and sub-national populations, as well as social and
ethnic groups. It uses standard demographic methods of cohort componentprojections, household headship rates and economic activity rates. Itsflexibility allows integration of official statistics and ancillary data. UnitaryAuthority trend based population projections are likely to be published in June2008 with household projections in 2009. The County Council have purchasedthe POGROUP software and will be running their own policy basedprojections in due course.