Download full version (PDF 311 KB) - The Institute For Fiscal Studies
Download full version (PDF 311 KB) - The Institute For Fiscal Studies
Download full version (PDF 311 KB) - The Institute For Fiscal Studies

Create successful ePaper yourself
Turn your PDF publications into a flip-book with our unique Google optimized e-Paper software.
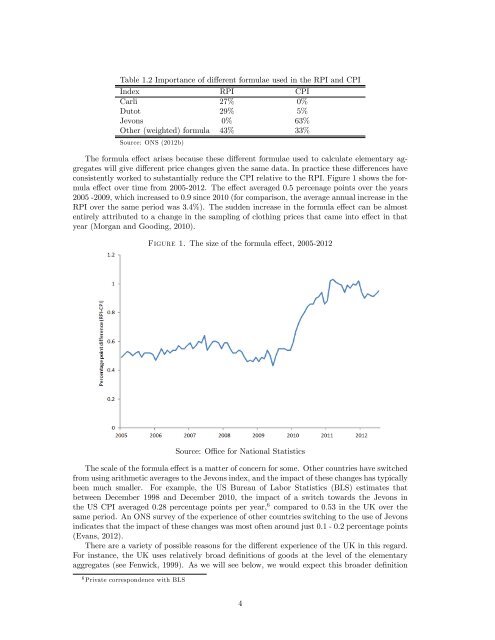
Table 1.2 Importance of different formulae used in the RPI and CPIIndex RPI CPICarli 27% 0%Dutot 29% 5%Jevons 0% 63%Other (weighted) formula 43% 33%Source: ONS (2012b)<strong>The</strong> formula effect arises because these different formulae used to calculate elementary aggregateswill give different price changes given the same data. In practice these differences haveconsistently worked to substantially reduce the CPI relative to the RPI. Figure 1 shows the formulaeffect over time from 2005-2012. <strong>The</strong> effect averaged 0.5 percenage points over the years2005 -2009, which increased to 0.9 since 2010 (for comparison, the average annual increase in theRPI over the same period was 3.4%). <strong>The</strong> sudden increase in the formula effect can be almostentirely attributed to a change in the sampling of clothing prices that came into effect in thatyear (Morgan and Gooding, 2010).Figure 1. <strong>The</strong> size of the formula effect, 2005-2012Source: Offi ce for National Statistics<strong>The</strong> scale of the formula effect is a matter of concern for some. Other countries have switchedfrom using arithmetic averages to the Jevons index, and the impact of these changes has typicallybeen much smaller. <strong>For</strong> example, the US Bureau of Labor Statistics (BLS) estimates thatbetween December 1998 and December 2010, the impact of a switch towards the Jevons inthe US CPI averaged 0.28 percentage points per year, 6 compared to 0.53 in the UK over thesame period. An ONS survey of the experience of other countries switching to the use of Jevonsindicates that the impact of these changes was most often around just 0.1 - 0.2 percentage points(Evans, 2012).<strong>The</strong>re are a variety of possible reasons for the different experience of the UK in this regard.<strong>For</strong> instance, the UK uses relatively broad definitions of goods at the level of the elementaryaggregates (see Fenwick, 1999). As we will see below, we would expect this broader definition6 Private correspondence with BLS4