Download full version (PDF 311 KB) - The Institute For Fiscal Studies
Download full version (PDF 311 KB) - The Institute For Fiscal Studies
Download full version (PDF 311 KB) - The Institute For Fiscal Studies

Create successful ePaper yourself
Turn your PDF publications into a flip-book with our unique Google optimized e-Paper software.
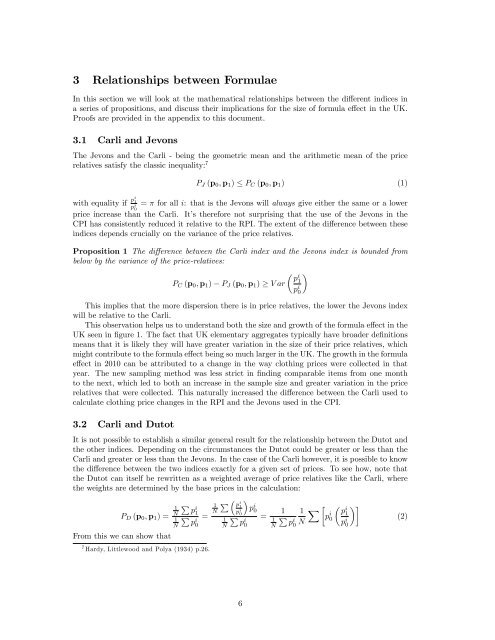
3 Relationships between <strong>For</strong>mulaeIn this section we will look at the mathematical relationships between the different indices ina series of propositions, and discuss their implications for the size of formula effect in the UK.Proofs are provided in the appendix to this document.3.1 Carli and Jevons<strong>The</strong> Jevons and the Carli - being the geometric mean and the arithmetic mean of the pricerelatives satisfy the classic inequality: 7P J (p 0 , p 1 ) ≤ P C (p 0 , p 1 ) (1)with equality if pi 1= π for all i: that is the Jevons will always give either the same or a lowerp i 0price increase than the Carli. It’s therefore not surprising that the use of the Jevons in theCPI has consistently reduced it relative to the RPI. <strong>The</strong> extent of the difference between theseindices depends crucially on the variance of the price relatives.Proposition 1 <strong>The</strong> difference between the Carli index and the Jevons index is bounded frombelow by the variance of the price-relatives: piP C (p 0 , p 1 ) − P J (p 0 , p 1 ) ≥ V ar 1This implies that the more dispersion there is in price relatives, the lower the Jevons indexwill be relative to the Carli.This observation helps us to understand both the size and growth of the formula effect in theUK seen in figure 1. <strong>The</strong> fact that UK elementary aggregates typically have broader definitionsmeans that it is likely they will have greater variation in the size of their price relatives, whichmight contribute to the formula effect being so much larger in the UK. <strong>The</strong> growth in the formulaeffect in 2010 can be attributed to a change in the way clothing prices were collected in thatyear. <strong>The</strong> new sampling method was less strict in finding comparable items from one monthto the next, which led to both an increase in the sample size and greater variation in the pricerelatives that were collected. This naturally increased the difference between the Carli used tocalculate clothing price changes in the RPI and the Jevons used in the CPI.3.2 Carli and DutotIt is not possible to establish a similar general result for the relationship between the Dutot andthe other indices. Depending on the circumstances the Dutot could be greater or less than theCarli and greater or less than the Jevons. In the case of the Carli however, it is possible to knowthe difference between the two indices exactly for a given set of prices. To see how, note thatthe Dutot can itself be rewritten as a weighted average of price relatives like the Carli, wherethe weights are determined by the base prices in the calculation:P D (p 0 , p 1 ) =From this we can show that1PN piP 1= pi01N7 Hardy, Littlewood and Polya (1934) p.26.1NP p i 1p i p i 00P = pi01N1Np i 01 1 X pP p i i1pi 00Np i 0(2)6