Thermodynamic, Transport, and Chemical Properties of âReference ...
Thermodynamic, Transport, and Chemical Properties of âReference ...
Thermodynamic, Transport, and Chemical Properties of âReference ...

Create successful ePaper yourself
Turn your PDF publications into a flip-book with our unique Google optimized e-Paper software.
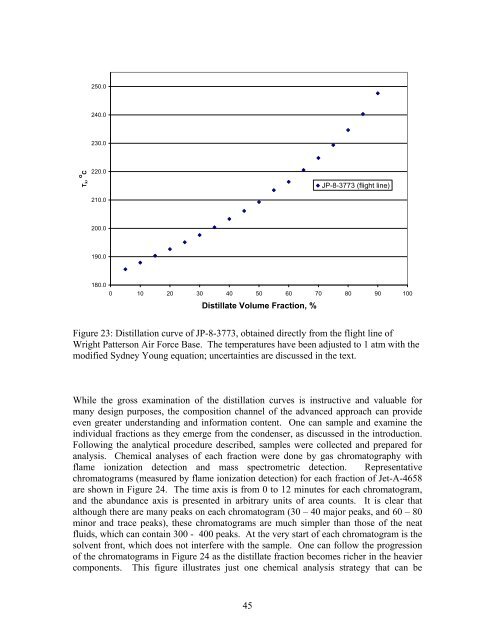
250.0240.0230.0T k , o C220.0210.0JP-8-3773 (flight line)200.0190.0180.00 10 20 30 40 50 60 70 80 90 100Distillate Volume Fraction, %Figure 23: Distillation curve <strong>of</strong> JP-8-3773, obtained directly from the flight line <strong>of</strong>Wright Patterson Air Force Base. The temperatures have been adjusted to 1 atm with themodified Sydney Young equation; uncertainties are discussed in the text.While the gross examination <strong>of</strong> the distillation curves is instructive <strong>and</strong> valuable formany design purposes, the composition channel <strong>of</strong> the advanced approach can provideeven greater underst<strong>and</strong>ing <strong>and</strong> information content. One can sample <strong>and</strong> examine theindividual fractions as they emerge from the condenser, as discussed in the introduction.Following the analytical procedure described, samples were collected <strong>and</strong> prepared foranalysis. <strong>Chemical</strong> analyses <strong>of</strong> each fraction were done by gas chromatography withflame ionization detection <strong>and</strong> mass spectrometric detection. Representativechromatograms (measured by flame ionization detection) for each fraction <strong>of</strong> Jet-A-4658are shown in Figure 24. The time axis is from 0 to 12 minutes for each chromatogram,<strong>and</strong> the abundance axis is presented in arbitrary units <strong>of</strong> area counts. It is clear thatalthough there are many peaks on each chromatogram (30 – 40 major peaks, <strong>and</strong> 60 – 80minor <strong>and</strong> trace peaks), these chromatograms are much simpler than those <strong>of</strong> the neatfluids, which can contain 300 - 400 peaks. At the very start <strong>of</strong> each chromatogram is thesolvent front, which does not interfere with the sample. One can follow the progression<strong>of</strong> the chromatograms in Figure 24 as the distillate fraction becomes richer in the heaviercomponents. This figure illustrates just one chemical analysis strategy that can be45