Quantification of Pythium populations in ginseng soils - Mount Saint ...
Quantification of Pythium populations in ginseng soils - Mount Saint ...
Quantification of Pythium populations in ginseng soils - Mount Saint ...

You also want an ePaper? Increase the reach of your titles
YUMPU automatically turns print PDFs into web optimized ePapers that Google loves.
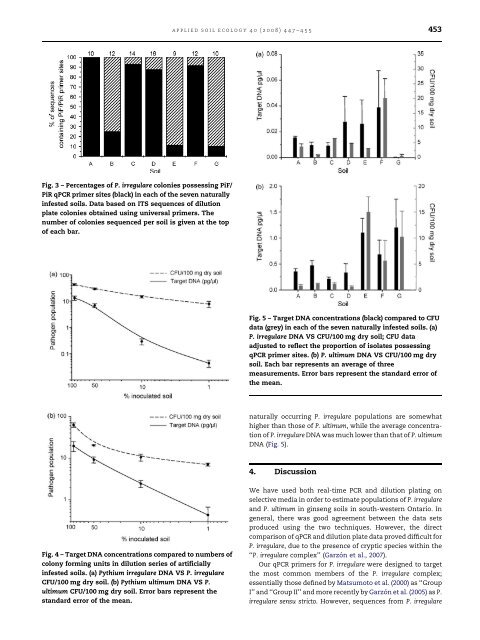
applied soil ecology 40 (2008) 447–455 453Fig. 3 – Percentages <strong>of</strong> P. irregulare colonies possess<strong>in</strong>g PiF/PiR qPCR primer sites (black) <strong>in</strong> each <strong>of</strong> the seven naturally<strong>in</strong>fested <strong>soils</strong>. Data based on ITS sequences <strong>of</strong> dilutionplate colonies obta<strong>in</strong>ed us<strong>in</strong>g universal primers. Thenumber <strong>of</strong> colonies sequenced per soil is given at the top<strong>of</strong> each bar.Fig. 5 – Target DNA concentrations (black) compared to CFUdata (grey) <strong>in</strong> each <strong>of</strong> the seven naturally <strong>in</strong>fested <strong>soils</strong>. (a)P. irregulare DNA VS CFU/100 mg dry soil; CFU dataadjusted to reflect the proportion <strong>of</strong> isolates possess<strong>in</strong>gqPCR primer sites. (b) P. ultimum DNA VS CFU/100 mg drysoil. Each bar represents an average <strong>of</strong> threemeasurements. Error bars represent the standard error <strong>of</strong>the mean.naturally occurr<strong>in</strong>g P. irregulare <strong>populations</strong> are somewhathigher than those <strong>of</strong> P. ultimum, while the average concentration<strong>of</strong> P. irregulare DNA was much lower than that <strong>of</strong> P. ultimumDNA (Fig. 5).4. DiscussionFig. 4 – Target DNA concentrations compared to numbers <strong>of</strong>colony form<strong>in</strong>g units <strong>in</strong> dilution series <strong>of</strong> artificially<strong>in</strong>fested <strong>soils</strong>. (a) <strong>Pythium</strong> irregulare DNA VS P. irregulareCFU/100 mg dry soil. (b) <strong>Pythium</strong> ultimum DNA VS P.ultimum CFU/100 mg dry soil. Error bars represent thestandard error <strong>of</strong> the mean.We have used both real-time PCR and dilution plat<strong>in</strong>g onselective media <strong>in</strong> order to estimate <strong>populations</strong> <strong>of</strong> P. irregulareand P. ultimum <strong>in</strong> g<strong>in</strong>seng <strong>soils</strong> <strong>in</strong> south-western Ontario. Ingeneral, there was good agreement between the data setsproduced us<strong>in</strong>g the two techniques. However, the directcomparison <strong>of</strong> qPCR and dilution plate data proved difficult forP. irregulare, due to the presence <strong>of</strong> cryptic species with<strong>in</strong> the‘‘P. irregulare complex’’ (Garzón et al., 2007).Our qPCR primers for P. irregulare were designed to targetthe most common members <strong>of</strong> the P. irregulare complex;essentially those def<strong>in</strong>ed by Matsumoto et al. (2000) as ‘‘GroupI’’ and ‘‘Group II’’ and more recently by Garzón et al. (2005) as P.irregulare sensu stricto. However, sequences from P. irregulare