Mass Media in Zambia Demand-Side Measures ... - AudienceScapes
Mass Media in Zambia Demand-Side Measures ... - AudienceScapes
Mass Media in Zambia Demand-Side Measures ... - AudienceScapes

Create successful ePaper yourself
Turn your PDF publications into a flip-book with our unique Google optimized e-Paper software.
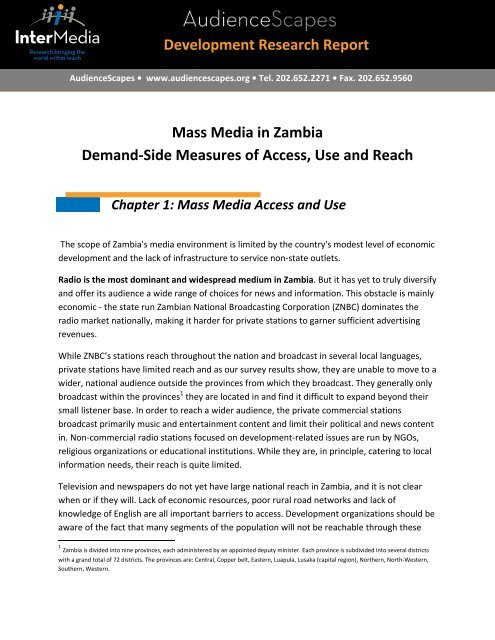
Development Research Report<strong>AudienceScapes</strong> • www.audiencescapes.org • Tel. 202.652.2271 • Fax. 202.652.9560<strong>Mass</strong> <strong>Media</strong> <strong>in</strong> <strong>Zambia</strong><strong>Demand</strong>‐<strong>Side</strong> <strong>Measures</strong> of Access, Use and ReachChapter 1: <strong>Mass</strong> <strong>Media</strong> Access and UseThe scope of <strong>Zambia</strong>'s media environment is limited by the country's modest level of economicdevelopment and the lack of <strong>in</strong>frastructure to service non‐state outlets.Radio is the most dom<strong>in</strong>ant and widespread medium <strong>in</strong> <strong>Zambia</strong>. But it has yet to truly diversifyand offer its audience a wide range of choices for news and <strong>in</strong>formation. This obstacle is ma<strong>in</strong>lyeconomic ‐ the state run <strong>Zambia</strong>n National Broadcast<strong>in</strong>g Corporation (ZNBC) dom<strong>in</strong>ates theradio market nationally, mak<strong>in</strong>g it harder for private stations to garner sufficient advertis<strong>in</strong>grevenues.While ZNBC’s stations reach throughout the nation and broadcast <strong>in</strong> several local languages,private stations have limited reach and as our survey results show, they are unable to move to awider, national audience outside the prov<strong>in</strong>ces from which they broadcast. They generally onlybroadcast with<strong>in</strong> the prov<strong>in</strong>ces 1 they are located <strong>in</strong> and f<strong>in</strong>d it difficult to expand beyond theirsmall listener base. In order to reach a wider audience, the private commercial stationsbroadcast primarily music and enterta<strong>in</strong>ment content and limit their political and news content<strong>in</strong>. Non‐commercial radio stations focused on development‐related issues are run by NGOs,religious organizations or educational <strong>in</strong>stitutions. While they are, <strong>in</strong> pr<strong>in</strong>ciple, cater<strong>in</strong>g to local<strong>in</strong>formation needs, their reach is quite limited.Television and newspapers do not yet have large national reach <strong>in</strong> <strong>Zambia</strong>, and it is not clearwhen or if they will. Lack of economic resources, poor rural road networks and lack ofknowledge of English are all important barriers to access. Development organizations should beaware of the fact that many segments of the population will not be reachable through these1 <strong>Zambia</strong> is divided <strong>in</strong>to n<strong>in</strong>e prov<strong>in</strong>ces, each adm<strong>in</strong>istered by an appo<strong>in</strong>ted deputy m<strong>in</strong>ister. Each prov<strong>in</strong>ce is subdivided <strong>in</strong>to several districtswith a grand total of 72 districts. The prov<strong>in</strong>ces are: Central, Copper belt, Eastern, Luapula, Lusaka (capital region), Northern, North‐Western,Southern, Western.
Figure 1.2Television access shows strong correlation to the respondents’ location (whether urban orrural) given that urban access levels are three times that of rural respondents. TV access alsorises alongside <strong>in</strong>come level from tier 1 (the lowest) to tier 4 (the highest).Respondents’ gender and age do not seem to have a great <strong>in</strong>fluence on their level of householdaccess.<strong>Media</strong> access and level of developmentAccess to radio is also <strong>in</strong>fluenced by the availability of various wavebands <strong>in</strong> each of theprov<strong>in</strong>ces. ZNBC's Radio 1 and Radio 2 are the only national stations broadcast<strong>in</strong>g on shortwaveand are nationally available. A wide variety of commercial, community, religious andeducational stations broadcast on FM, but none are nationally accessible.Generally, prov<strong>in</strong>ces lower <strong>in</strong> the HDI scale have fewer private FM stations; thus, radio listeners<strong>in</strong> these prov<strong>in</strong>ces listen <strong>in</strong> higher proportions to SW broadcasts from the state radio. On theother hand, a wide variety of FM stations are available <strong>in</strong> more‐developed prov<strong>in</strong>ces such asLusaka and Copperbelt (see more on specific radio outlets <strong>in</strong> the follow<strong>in</strong>g section), andlistenership <strong>in</strong> these areas is dom<strong>in</strong>ated by FM radio, while SW and Medium Wave (MW)listenership is low (Figure 1.3).
Listen<strong>in</strong>g to radio via mobile phones, the <strong>in</strong>ternet and satellite is also correlated with HDIrank<strong>in</strong>gs with<strong>in</strong> the prov<strong>in</strong>ces‐ the higher‐HDI prov<strong>in</strong>ces such as Lusaka, Copperbelt, Central andSouthern have higher levels of radio listenership via these delivery modes (Figure 1.4).______________________________________________________________________________Figure 1.4_____________________________________________________________________________
Ib: <strong>Media</strong> UseIn addition to hav<strong>in</strong>g household access to a mass media device, the frequency with whichrespondents say they use a medium 2 , can illustrate evidence of shared use of media‐ such ascommunal television view<strong>in</strong>g, shar<strong>in</strong>g newspapers among households, etc. It can also po<strong>in</strong>t outto <strong>in</strong>stances of limited use of a medium despite its availability <strong>in</strong> the household, thus giv<strong>in</strong>g amore holistic view of media reach.<strong>Measures</strong> <strong>in</strong> the survey of "media use" ‐ the frequency with which respondents said they USEa certa<strong>in</strong> medium ‐ suggest that use outside the home is not a significant factor. In otherwords, there was very little difference between the percentage of people say<strong>in</strong>g they havehousehold access to a given medium and the percentage of people who said they use thatmedium regularly (compare Figure 1.5 with access figures above).However, some demographic factors such as <strong>in</strong>come and English language skills, as well asgeographic location, seem to be correlated to medium use.Figure 1.5 illustrates that radio is the most widely used mass medium among both rural andurban populations and thus likely to be the most efficient way to reach the largest numberand most diverse set of <strong>Zambia</strong>ns on a national scale. Radio is thus is an important conduitthrough which development workers can communicate with both literate and economicallyadvanced urban populations, as well poorer and illiterate populations at relatively similar costs.________________________________________________________________________Figure 1.5__________________________________________________________________________2 Regular users are def<strong>in</strong>ed <strong>in</strong> this report as those who use a medium at least weekly
Income variation also comes <strong>in</strong>to play <strong>in</strong> use patterns for <strong>Zambia</strong>n media. Televisions rank low<strong>in</strong> weekly use by lower‐<strong>in</strong>come residents (Figure 1.6). For the poorest tiers of <strong>Zambia</strong>n society,radio is the most important (and sometimes only) source of news and <strong>in</strong>formation. As <strong>in</strong>come<strong>in</strong>creases, weekly use for both radio and television <strong>in</strong>crease. In fact the rate of televisionviewership among respondents <strong>in</strong> the top <strong>in</strong>come tier (tier 4) is nearly double that ofrespondents <strong>in</strong> tier 3.___________________________________________________________________________Figure 1.6_________________________________________________________________________________Newspapers, however, are not a particularly widespread source of <strong>in</strong>formation for any <strong>in</strong>cometier and are only marg<strong>in</strong>ally significant sources for the wealthiest (37 percent of the wealthiestsaid they read newspapers weekly, compared to 84 percent who watch television weekly).There is only a slight gender gap for weekly radio use (Figure 1.7A). In general, age is not astrong determ<strong>in</strong>ant of access or regular use (Figure 1.7B).
________________________________________________________________________Figure 1.7 A____________________________________________________________________________________________________Figure 1.7 B____________________________________________________________________________
Knowledge of English (both speak<strong>in</strong>g and read<strong>in</strong>g) appears to be a determ<strong>in</strong><strong>in</strong>g factor <strong>in</strong><strong>Zambia</strong>ns' media use (Figures 1.8 and 1.9), especially for television viewership and newspaperreadership.Twenty‐four percent of <strong>AudienceScapes</strong> survey respondents said they neither speak norunderstand English, with the percentages com<strong>in</strong>g <strong>in</strong> higher <strong>in</strong> less developed prov<strong>in</strong>ces such asLuapala (46 percent) and Southern (38 percent). The <strong>in</strong>ability to speak and understand Englishis also greater among women than men and for those <strong>in</strong> the lowest <strong>in</strong>come tier <strong>in</strong> our survey(40 percent <strong>in</strong> the lowest Tier 1, compared to 5 percent <strong>in</strong> the highest Tier 4).Though radio stations (especially state‐run stations and community stations broadcast<strong>in</strong>g <strong>in</strong>specific prov<strong>in</strong>ces) often broadcast content <strong>in</strong> vernacular languages, television stationsbroadcast mostly <strong>in</strong> English. 3 State‐run ZNBC TV has 35 m<strong>in</strong>utes of vernacular content everyday. Figure 1.8 shows the relationship between English skills and television viewership. Notethat weekly television viewership is most affected by levels of English skills._________________________________________________________________________Figure 1.8_________________________________________________________________________3 <strong>Zambia</strong> 2009. African <strong>Media</strong> Barometer. Published by the <strong>Media</strong> Institute of South Africa and FES <strong>Media</strong> Africa. Available here:http://fesmedia.org/uploads/media/AMB_<strong>Zambia</strong>_2009_English.pdf and http://www.iicd.org/articles/iicdnews.2004‐12‐14.1069141762#ComRad, Page 32.
Twenty four percent of our respondents said they do not read English at all, and 28 percent saidthey are unable to read English easily.All nationally available daily <strong>Zambia</strong>n newspapers publish <strong>in</strong> English and thus have limited reachamong those who cannot read English (Figure 1.9)._________________________________________________________________________Figure 1.9__________________________________________________________________________
The Hyper Users‐ Those Who Use <strong>Media</strong> DailyThe figure below shows the proportion of respondents from each <strong>in</strong>come tier, genderand location type who said they listen to the radio or watch TV daily. These hyper usershave greater representation among males, urbanites and those with relatively higher<strong>in</strong>comes.Ic: News Source Preferences and Op<strong>in</strong>ion LeadershipDevelopment strategists sometimes focus communication and <strong>in</strong>formation‐shar<strong>in</strong>g efforts on<strong>in</strong>fluential members of a group, under the assumption that such people (op<strong>in</strong>ion leaders) willhave a disproportionate impact on the views and attitudes of the group as a whole. Theconcept of op<strong>in</strong>ion leadership is applied <strong>in</strong> many areas of social science research, notably <strong>in</strong>science communication and election studies, to understand how some <strong>in</strong>dividuals exertrelatively strong sway on a general population. 4In the <strong>AudienceScapes</strong> framework, we def<strong>in</strong>e op<strong>in</strong>ion leaders as those whom others turn tomost for <strong>in</strong>formation and perspectives on various issues. 54 Matthew Nisbet, Ph.D, Professor at American University, "A Two Step Flow of Influence? Op<strong>in</strong>ion Leader Campaigns onClimate Change" Science Communication, March 2009, 30.5 <strong>Zambia</strong>n op<strong>in</strong>ion leaders were def<strong>in</strong>ed as the top third of <strong>Zambia</strong>ns with the highest cumulative po<strong>in</strong>ts on four items: (1) howoften people came to a respondent to get news and <strong>in</strong>formation; (2) how often respondents discussed news and <strong>in</strong>formation
As Figure 1.10 illustrates, op<strong>in</strong>ion leaders <strong>in</strong> <strong>Zambia</strong> are not very dist<strong>in</strong>ct demograhpically; theytend to mirror the general population <strong>in</strong> terms of distribution across regions, ages and tiers of<strong>in</strong>come, though more op<strong>in</strong>ion leaders tend to be male and relatively older than the average.Figure 1.10<strong>Zambia</strong>: Op<strong>in</strong>ion leaders Compared to the General PublicPercentages represent proportion of each demographic type with<strong>in</strong> group of op<strong>in</strong>ion leaders or generalpopulationGeneralPopulationOp<strong>in</strong>ionLeadersGeneralPopulationOp<strong>in</strong>ionLeadersGenderLocationmale 50.7% 57.9% Rural 66% 64.2%female 49.3% 42.1% Urban 34% 35.8%AgeIncomeyouth 35.6% 28.5% tier 1 (lowest) 18.8% 17.1%young adult 30.4% 32.8% tier 2 35.2% 33.6%adult 1 14.5% 12.6% tier 3 26.9% 25.5%adult 2 19.4% 26.1% tier 4 (highest) 19.1% 23.9%<strong>AudienceScapes</strong> National <strong>Media</strong> Survey <strong>Zambia</strong>, April 2010. N = 2000, and N = 195 for Op<strong>in</strong>ion Leaderswith others <strong>in</strong> their community; (3) how often people asked the respondent for their op<strong>in</strong>ion or advice on major news stories;and (4) the number of people looked to the respondent for their op<strong>in</strong>ion or advice on major topics <strong>in</strong> the news.
Op<strong>in</strong>ion leaders also appear to be more <strong>in</strong>tensive users of all mass media (Figure 1.12).__________________________________________________________________________Figure 1.12__________________________________________________________________________Interest<strong>in</strong>gly, friends and family emerge as important sources of <strong>in</strong>formation for op<strong>in</strong>ionleaders, suggest<strong>in</strong>g that they are as keen to ga<strong>in</strong> and share knowledge via word‐of‐mouthsources as via media sources (Figure 1.13).___________________________________________________________________________Figure 1.13___________________________________________________________________________
Figure 1.14 shows the range of subjects that op<strong>in</strong>ion leaders and <strong>Zambia</strong>ns as a whole focus onwhen they listen to the radio. Regardless of medium (Figure 1.14 shows results for radio, butthey are similar for television and newspapers), <strong>Zambia</strong>n op<strong>in</strong>ion leaders pay significantly moreattention to bus<strong>in</strong>ess and f<strong>in</strong>ancial news, agricultural issues, and government services<strong>in</strong>formation than the general population. National and local current events <strong>in</strong>formation is alsopopular among op<strong>in</strong>ion leaders <strong>in</strong> comparison to the general public, particularly for radiolisteners._____________________________________________________________________________Figure 1.14______________________________________________________________________________