Global Production of Ceramic Tiles - Infotile
Global Production of Ceramic Tiles - Infotile
Global Production of Ceramic Tiles - Infotile

Create successful ePaper yourself
Turn your PDF publications into a flip-book with our unique Google optimized e-Paper software.
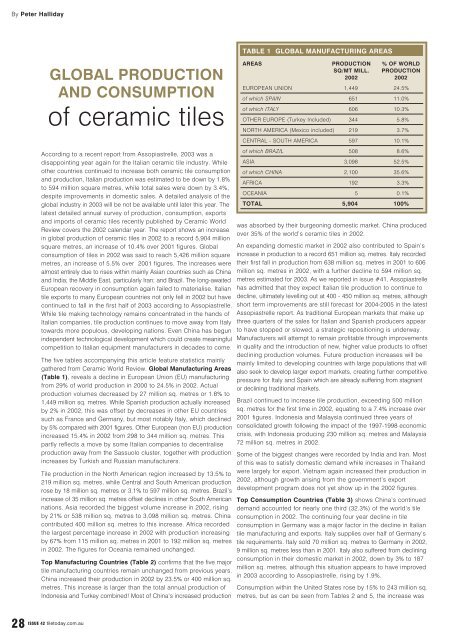
By Peter HallidayGLOBAL PRODUCTIONAND CONSUMPTION<strong>of</strong> ceramic tilesAccording to a recent report from Assopiastrelle, 2003 was adisappointing year again for the Italian ceramic tile industry. Whileother countries continued to increase both ceramic tile consumptionand production, Italian production was estimated to be down by 1.8%to 594 million square metres, while total sales were down by 3.4%,despite improvements in domestic sales. A detailed analysis <strong>of</strong> theglobal industry in 2003 will be not be available until later this year. Thelatest detailed annual survey <strong>of</strong> production, consumption, exportsand imports <strong>of</strong> ceramic tiles recently published by <strong>Ceramic</strong> WorldReview covers the 2002 calendar year. The report shows an increasein global production <strong>of</strong> ceramic tiles in 2002 to a record 5,904 millionsquare metres, an increase <strong>of</strong> 10.4% over 2001 figures. <strong>Global</strong>consumption <strong>of</strong> tiles in 2002 was said to reach 5,426 million squaremetres, an increase <strong>of</strong> 5.5% over 2001 figures. The increases werealmost entirely due to rises within mainly Asian countries such as Chinaand India; the Middle East, particularly Iran; and Brazil. The long-awaitedEuropean recovery in consumption again failed to materialise. Italiantile exports to many European countries not only fell in 2002 but havecontinued to fall in the first half <strong>of</strong> 2003 according to Assopiastrelle.While tile making technology remains concentrated in the hands <strong>of</strong>Italian companies, tile production continues to move away from Italytowards more populous, developing nations. Even China has begunindependent technological development which could create meaningfulcompetition to Italian equipment manufacturers in decades to come.The five tables accompanying this article feature statistics mainlygathered from <strong>Ceramic</strong> World Review. <strong>Global</strong> Manufacturing Areas(Table 1), reveals a decline in European Union (EU) manufacturingfrom 29% <strong>of</strong> world production in 2000 to 24.5% in 2002. Actualproduction volumes decreased by 27 million sq. metres or 1.8% to1,449 million sq. metres. While Spanish production actually increasedby 2% in 2002, this was <strong>of</strong>fset by decreases in other EU countriessuch as France and Germany, but most notably Italy, which declinedby 5% compared with 2001 figures. Other European (non EU) productionincreased 15.4% in 2002 from 298 to 344 million sq. metres. Thispartly reflects a move by some Italian companies to decentraliseproduction away from the Sassuolo cluster, together with productionincreases by Turkish and Russian manufacturers.Tile production in the North American region increased by 13.5% to219 million sq. metres, while Central and South American productionrose by 18 million sq. metres or 3.1% to 597 million sq. metres. Brazil’sincrease <strong>of</strong> 35 million sq. metres <strong>of</strong>fset declines in other South Americannations. Asia recorded the biggest volume increase in 2002, risingby 21% or 538 million sq. metres to 3,098 million sq. metres. Chinacontributed 400 million sq. metres to this increase. Africa recordedthe largest percentage increase in 2002 with production increasingby 67% from 115 million sq. metres in 2001 to 192 million sq. metresin 2002. The figures for Oceania remained unchanged.Top Manufacturing Countries (Table 2) confirms that the five majortile manufacturing countries remain unchanged from previous years.China increased their production in 2002 by 23.5% or 400 million sq.metres. This increase is larger than the total annual production <strong>of</strong>Indonesia and Turkey combined! Most <strong>of</strong> China’s increased productionTABLE 1 GLOBAL MANUFACTURING AREASAREAS PRODUCTION % OF WORLDSQ/MT MILL. PRODUCTION2002 2002EUROPEAN UNION 1,449 24.5%<strong>of</strong> which SPAIN 651 11.0%<strong>of</strong> which ITALY 606 10.3%OTHER EUROPE (Turkey Included) 344 5.8%NORTH AMERICA (Mexico included) 219 3.7%CENTRAL - SOUTH AMERICA 597 10.1%<strong>of</strong> which BRAZIL 508 8.6%ASIA 3,098 52.5%<strong>of</strong> which CHINA 2,100 35.6%AFRICA 192 3.3%OCEANIA 5 0.1%TOTAL 5,904 100%was absorbed by their burgeoning domestic market. China producedover 35% <strong>of</strong> the world’s ceramic tiles in 2002.An expanding domestic market in 2002 also contributed to Spain’sincrease in production to a record 651 million sq. metres. Italy recordedtheir first fall in production from 638 million sq. metres in 2001 to 606million sq. metres in 2002, with a further decline to 594 million sq.metres estimated for 2003. As we reported in issue #41, Assopiastrellehas admitted that they expect Italian tile production to continue todecline, ultimately levelling out at 400 - 450 million sq. metres, althoughshort term improvements are still forecast for 2004-2005 in the latestAssopiastrelle report. As traditional European markets that make upthree quarters <strong>of</strong> the sales for Italian and Spanish producers appearto have stopped or slowed, a strategic repositioning is underway.Manufacturers will attempt to remain pr<strong>of</strong>itable through improvementsin quality and the introduction <strong>of</strong> new, higher value products to <strong>of</strong>fsetdeclining production volumes. Future production increases will bemainly limited to developing countries with large populations that willalso seek to develop larger export markets, creating further competitivepressure for Italy and Spain which are already suffering from stagnantor declining traditional markets.Brazil continued to increase tile production, exceeding 500 millionsq. metres for the first time in 2002, equating to a 7.4% increase over2001 figures. Indonesia and Malaysia continued three years <strong>of</strong>consolidated growth following the impact <strong>of</strong> the 1997-1998 economiccrisis, with Indonesia producing 230 million sq. metres and Malaysia72 million sq. metres in 2002.Some <strong>of</strong> the biggest changes were recorded by India and Iran. Most<strong>of</strong> this was to satisfy domestic demand while increases in Thailandwere largely for export. Vietnam again increased their production in2002, although growth arising from the government’s exportdevelopment program does not yet show up in the 2002 figures.Top Consumption Countries (Table 3) shows China’s continueddemand accounted for nearly one third (32.3%) <strong>of</strong> the world’s tileconsumption in 2002. The continuing four year decline in tileconsumption in Germany was a major factor in the decline in Italiantile manufacturing and exports. Italy supplies over half <strong>of</strong> Germany’stile requirements. Italy sold 70 million sq. metres to Germany in 2002,9 million sq. metres less than in 2001. Italy also suffered from decliningconsumption in their domestic market in 2002, down by 3% to 187million sq. metres, although this situation appears to have improvedin 2003 according to Assopiastrelle, rising by 1.9%.Consumption within the United States rose by 15% to 243 million sq.metres, but as can be seen from Tables 2 and 5, the increase was28ISSUE 42 tiletoday.com.au
almost entirely made up from imports. India and South Korea recordedthe largest rises in consumption in percentage terms in 2002, increasing42% and 41% respectively. The biggest decline was in Indonesia whichrecorded a decline <strong>of</strong> 58 million sq. metres or 35% to 110 million sq.meters in 2002. Indonesian exports slightly <strong>of</strong>fset this drop, increasingby 20 million sq. metres for the same period. Taiwan continued itslong decline, consuming 22% less in 2002 than in 2001.Australia was the world’s 26th largest tile consuming nation in 2002,moving up from the 30th position when we last published the surveyfigures in issue #37, due largely to the recovery in residential housingconstruction.Top Exporting Countries (Table 4) reveals that exports <strong>of</strong> ceramictiles amounted to 25.5% <strong>of</strong> global consumption and 23.4% <strong>of</strong> globalproduction in 2002. Exports have been steadily increasing by roughly0.5% per annum since the mid 1990’s. The widening <strong>of</strong> integratedmarkets such as the enlarged European Union will mean that referringto exports within these areas will become increasingly meaningless asgeographic borders become irrelevant to trade. Italy and Spain are stillthe largest exporting countries but they are experiencing increasedcompetition for export sales from emerging manufacturing nations,particularly from Asia and Brazil. During 2002, Italy and Spain togetheraccounted for 57.3% <strong>of</strong> world exports. This was a drop from 70.6% <strong>of</strong>world exports in 1996, 66.3% in 2000 and 64.2% in 2001. Assopiastrellehas reported that Italian export volumes declined by 2.6% in the firsthalf <strong>of</strong> 2003 and estimate a fall in export sales <strong>of</strong> 5.5% during the full2003 calendar year.The 2002 export figures supplied by the China Building <strong>Ceramic</strong>s andSanitaryware Association in Table 4 are thought to be overstated by<strong>Ceramic</strong> World Review, however there can be no doubt that Chineseexports are quickly increasing as evidenced by a glance at the productsin many importers’ warehouses. Brazil improved their exportperformance in 2002, overtaking Turkey as the fourth largest exportingTABLE 2 TOP MANUFACTURING COUNTRIESRANK COUNTRY 1999 2000 2001 2002 % OF WORLD % CHANGE(Sq Mtrs mill) (Sq Mtrs mill) (Sq Mtrs mill) (Sq Mtrs mill) PRODUCTION 2002 2001 TO 20021 CHINA 1,600 1,600 1,700 2,100 35.6% 23.5%2 SPAIN 602 621 638 651 11.0% 2.0%3 ITALY 606 632 638 606 10.3% -5.0%4 BRAZIL 428 453 473 508 8.6% 7.4%5 INDONESIA 130 200 220 230 3.9% 4.5%6 TURKEY 150 175 150 162 2.7% 8.0%7 MEXICO 130 138 167 159 2.7% -4.8%8 INDIA 85 97 109 150 2.5% 37.6%9 IRAN 60 71 78 105 1.8% 34.6%10 VIETNAM 29 55 95 105 1.8% 10.5%11 THAILAND 70 56 63 90 1.5% 42.9%12 EGYPT 42 50 65 83 1.4% 27.7%13 MALAYSIA 50 58 67 72 1.2% 7.5%14 PORTUGAL 60 64 66 69 1.2% 4.5%15 RUSSIA 25 30 45 58 1.0% 28.9%16 USA 59 60 55 58 1.0% 5.5%17 SOUTH KOREA 39 48 50 56 0.9% 12.0%18 GERMANY 64 62 57 54 0.9% -5.3%19 JAPAN 54 54 53 51 0.9% -3.8%20 POLAND 30 35 46 49 0.8% 6.5%21 UAE 30 40 40 48 0.8% 20.0%22 FRANCE 50 49 44 41 0.7% -6.8%23 TAIWAN 88 68 45 37 0.6% -17.8%24 MOROCCO 23 30 35 35 0.6% 0.0%25 ALGERIA 30 30 30 30 0.5% 0.0%26 CZECH REPUBLIC 27 30 30 29 0.5% -3.3%27 COLOMBIA 25 26 26 26 0.4% 0.0%28 PHILIPPINES 22 25 25 25 0.4% 0.0%29 SOUTH AFRICA 9 15 15 20 0.3% 33.3%30 TUNISIA 15 15 17 19 0.3% 11.8%TOTAL 4,632 4,887 5,142 5,726 97.0%TOTAL WORLD PRODUCTION 4,841 5,107 5,348 5,904 100.0THE 30 MAJOR MANUFACTURING COUNTRIES COVER ALMOST 97.0% OF WORLD PRODUCTIONtiletoday.com.au ISSUE 4229
GLOBAL PRODUCTIONAND CONSUMPTION<strong>of</strong> ceramic tilesTABLE 3 TOP CONSUMPTION COUNTRIESRANK COUNTRY 1999 2000 2001 2002 % OF WORLD % CHANGE(Sq Mtrs mill) (Sq Mtrs mill) (Sq Mtrs mill) (Sq Mtrs mill) CONSUMPTION 2001 TO 200220021 CHINA 1,300 1,300 1,600 1,750 32.3% 9.4%2 BRAZIL 383 395 417 436 8.0% 4.6%3 SPAIN 273 290 312 327 6.0% 4.8%4 USA 195 212 211 243 4.5% 15.2%5 ITALY 192 200 192 187 3.4% -2.6%6 INDIA 85 97 102 145 2.7% 42.2%7 GERMANY 192 184 164 144 2.7% -12.2%8 MEXICO 87 100 129 141 2.6% 9.3%9 FRANCE 114 122 125 124 2.3% -0.8%10 INDONESIA 95 164 168 110 2.0% -34.5%11 VIETNAM 29 55 95 98 1.8% 3.2%12 IRAN 54 65 72 90 1.7% 25.0%13 TURKEY 100 114 94 90 1.7% -4.3%14 SOUTH KOREA 44 49 59 83 1.5% 40.7%15 RUSSIA 31 38 65 77 1.4% 18.5%16 EGYPT 35 43 50 66 1.2% 32.0%17 PORTUGAL 56 68 60 66 1.2% 10.0%18 THAILAND 50 54 60 65 1.2% 8.3%19 POLAND 57 67 71 62 1.1% -12.7%20 SAUDI ARABIA 34 40 53 58 1.1% 9.4%21 UNITED KINGDOM 46 53 62 56 1.0% -9.7%22 JAPAN 56 57 56 54 1.0% -3.6%23 MALAYSIA 41 48 51 45 0.8% -11.8%24 TAIWAN 90 77 55 43 0.8% -21.8%25 ALGERIA 30 30 34 35 0.6% 2.9%26 AUSTRALIA 23 28 29 33 0.6% 13.8%27 MOROCCO 26 30 31 33 0.6% 6.5%28 GREECE 38 35 33 33 0.6% 0.0%29 UAE 23 28 27 29 0.5% 7.4%30 CANADA 20 23 25 29 0.5% 16.0%TOTAL 3,799 4,066 4,502 4,752 87.6%TOTAL WORLD CONSUMPTION 4,485 4,735 5,142 5,426 100.0THE 30 MAJOR MANUFACTURING COUNTRIES COVER ALMOST 87.6% OF WORLD CONSUMPTIONnation. Turkey still derives over 44% <strong>of</strong> their sales from export markets.The increase in the UAE figures is especially impressive as it is mainlyfrom one company, R.A.K <strong>Ceramic</strong>s.Top Importing Countries (Table 5) reveals that Germany’sdeclining tile consumption has severely effected import levels. TheUSA has now replaced Germany as the top importing country in theworld. Local production in the USA has also increased followingthe construction <strong>of</strong> new factories by Dal-Tile, in partnership withEmilceramica, and GranitiFiandre. Some Florida Tile productionfacilities were closed prior to the company’s sale late in 2003 withfurther closures announced in December 2003. Imports now make up77% <strong>of</strong> the USA market. It will be interesting to see if more foreignmanufacturers establish production facilities to take advantage <strong>of</strong> theflexibility <strong>of</strong> local supply and the opportunity to build a stronger brandimage within the world’s fourth largest market for tiles.Australian imports <strong>of</strong> ceramic tiles increased during 2002 and 2003as the market has continued to expand, as we outline in more detailin the accompanying article, Australian Tile Consumption and<strong>Production</strong>. Australia is now the seventh largest tile importing nationin the world. The imminent start-up <strong>of</strong> the new National <strong>Ceramic</strong>Industries Australia facility should in theory cause a drop in importfigures from mid 2004 onwards, although this will be partly <strong>of</strong>fsetby the closure <strong>of</strong> Johnson <strong>Tiles</strong>’ floor tile plant in April 2004 and thereplacement <strong>of</strong> their local production with floor tiles imported fromother companies within the Johnson group as well as other <strong>of</strong>fshorecontract manufacturers.Statistics courtesy <strong>of</strong> Graziano Sezzi, Editor, <strong>Ceramic</strong> World Review, Italy.TABLES 4 & 5 OVERLEAF30ISSUE 42 tiletoday.com.au
GLOBAL PRODUCTIONAND CONSUMPTION<strong>of</strong> ceramic tilesTABLE 4 TOP EXPORTING COUNTRIESRANK COUNTRY 1999 2000 2001 2002 % OF WORLD % CHANGE(Sq Mtrs mill) (Sq Mtrs mill) (Sq Mtrs mill) (Sq Mtrs mill) CONSUMPTION 2001 TO 200220021 ITALY 417 436 441 438 8.1% -0.7%2 SPAIN 270 312 339 356 6.6% 5.0%3 CHINA 19 24 53 100 1.8% 88.7%4 BRAZIL 43 48 47 72 1.3% 53.2%5 TURKEY 50 52 57 72 1.3% 26.3%6 INDONESIA 17 20 30 50 0.9% 66.7%7 UAE 15 20 22 39 0.7% 77.3%8 MEXICO 34 33 37 33 0.6% -10.8%9 MALAYSIA 14 15 23 29 0.5% 26.1%10 PORTUGAL 19 19 21 22 0.4% 4.8%11 GERMANY 21 20 21 22 0.4% 4.8%12 FRANCE 25 24 22 21 0.4% -4.5%13 CZECH REPUBLIC 14 16 17 17 0.3% 0.0%14 THAILAND 11 12 12 13 0.2% 8.3%15 EGYPT 0 0 9 12 0.2% 33.3%TOTAL 969 1,051 1,151 1,296 23.9%TOTAL WORLD EXPORTS 1,069 1,157 1,244 1,385 25.5%EXPORTS OF 15 MAJOR EXPORTING COUNTRIES REPRESENTS 23.9% OF WORLD CONSUMPTIONEXPORTS OF ITALY AND SPAIN REPRESENT 57.3% OF EXPORTS AND 14.7% OF WORLD CONSUMPTIONTABLE 5 TOP IMPORTING COUNTRIESRANK COUNTRY 1999 2000 2001 2002 % OF WORLD % CHANGE(Sq Mtrs mill) (Sq Mtrs mill) (Sq Mtrs mill) (Sq Mtrs mill) IMPORTS 2002 2001 TO 20021 USA 139 155 160 189 13.6% 18.1%2 GERMANY 149 143 127 113 8.2% -11.0%3 FRANCE 89 97 104 104 7.5% 0.0%4 SAUDI ARABIA 28 34 48 52 3.8% 8.3%5 UNITED KINGDOM 38 44 54 48 3.5% -11.1%6 GREECE 32 35 33 33 2.4% 0.0%7 AUSTRALIA 20 25 28 33 2.4% 17.9%8 SOUTH KOREA n.a. 10 22 32 2.3% 45.5%9 CANADA 19 21 24 27 1.9% 12.5%10 ISRAEL 22 25 31 25 1.8% -19.4%11 BELGIUM + LUX 24 26 25 24 1.7% -4.0%12 HONG KONG 18 23 23 20 1.4% -13.0%13 PORTUGAL 15 23 21 20 1.4% -4.8%14 NETHERLANDS 22 21 19 19 1.4% 0.0%15 POLAND 28 27 26 19 1.4% -26.9%16 SINGAPORE 17 16 16 16 1.2% 0.0%17 ITALY 12 13 14 16 1.2% 14.3%18 AUSTRIA 17 17 16 15 1.1% -6.3%19 HUNGARY 11 11 13 14 1.0% 7.7%20 MEXICO 6 6 8 13 0.9% 62.5%21 RUSSIA 6 8 13 12 0.9% -7.7%22 SOUTH AFRICA 7 8 7 12 0.9% 71.4%TOTAL 719 788 832 856 61.8%TOTAL WORLD IMPORTS 1,069 1,157 1,244 1,385 100.0%IMPORTS OF THE 22 MAJOR IMPORTING COUNTRIES REPRESENT 15.6% OF WORLD CONSUMPTIONIMPORTS OF USA REPRESENT 3.5% OF WORLD CONSUMPTION32ISSUE 42 tiletoday.com.au