Global Production of Ceramic Tiles - Infotile
Global Production of Ceramic Tiles - Infotile
Global Production of Ceramic Tiles - Infotile

You also want an ePaper? Increase the reach of your titles
YUMPU automatically turns print PDFs into web optimized ePapers that Google loves.
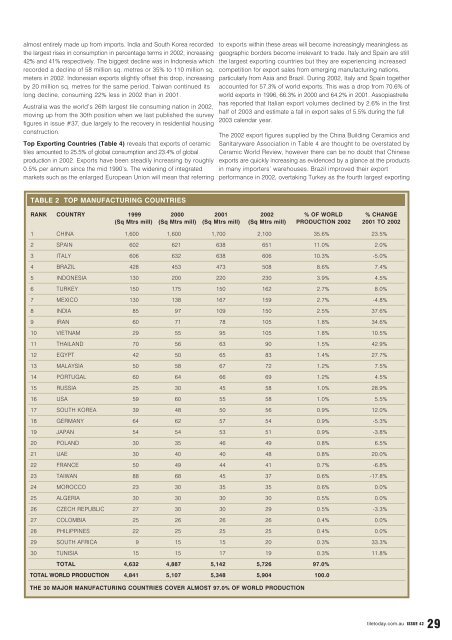
almost entirely made up from imports. India and South Korea recordedthe largest rises in consumption in percentage terms in 2002, increasing42% and 41% respectively. The biggest decline was in Indonesia whichrecorded a decline <strong>of</strong> 58 million sq. metres or 35% to 110 million sq.meters in 2002. Indonesian exports slightly <strong>of</strong>fset this drop, increasingby 20 million sq. metres for the same period. Taiwan continued itslong decline, consuming 22% less in 2002 than in 2001.Australia was the world’s 26th largest tile consuming nation in 2002,moving up from the 30th position when we last published the surveyfigures in issue #37, due largely to the recovery in residential housingconstruction.Top Exporting Countries (Table 4) reveals that exports <strong>of</strong> ceramictiles amounted to 25.5% <strong>of</strong> global consumption and 23.4% <strong>of</strong> globalproduction in 2002. Exports have been steadily increasing by roughly0.5% per annum since the mid 1990’s. The widening <strong>of</strong> integratedmarkets such as the enlarged European Union will mean that referringto exports within these areas will become increasingly meaningless asgeographic borders become irrelevant to trade. Italy and Spain are stillthe largest exporting countries but they are experiencing increasedcompetition for export sales from emerging manufacturing nations,particularly from Asia and Brazil. During 2002, Italy and Spain togetheraccounted for 57.3% <strong>of</strong> world exports. This was a drop from 70.6% <strong>of</strong>world exports in 1996, 66.3% in 2000 and 64.2% in 2001. Assopiastrellehas reported that Italian export volumes declined by 2.6% in the firsthalf <strong>of</strong> 2003 and estimate a fall in export sales <strong>of</strong> 5.5% during the full2003 calendar year.The 2002 export figures supplied by the China Building <strong>Ceramic</strong>s andSanitaryware Association in Table 4 are thought to be overstated by<strong>Ceramic</strong> World Review, however there can be no doubt that Chineseexports are quickly increasing as evidenced by a glance at the productsin many importers’ warehouses. Brazil improved their exportperformance in 2002, overtaking Turkey as the fourth largest exportingTABLE 2 TOP MANUFACTURING COUNTRIESRANK COUNTRY 1999 2000 2001 2002 % OF WORLD % CHANGE(Sq Mtrs mill) (Sq Mtrs mill) (Sq Mtrs mill) (Sq Mtrs mill) PRODUCTION 2002 2001 TO 20021 CHINA 1,600 1,600 1,700 2,100 35.6% 23.5%2 SPAIN 602 621 638 651 11.0% 2.0%3 ITALY 606 632 638 606 10.3% -5.0%4 BRAZIL 428 453 473 508 8.6% 7.4%5 INDONESIA 130 200 220 230 3.9% 4.5%6 TURKEY 150 175 150 162 2.7% 8.0%7 MEXICO 130 138 167 159 2.7% -4.8%8 INDIA 85 97 109 150 2.5% 37.6%9 IRAN 60 71 78 105 1.8% 34.6%10 VIETNAM 29 55 95 105 1.8% 10.5%11 THAILAND 70 56 63 90 1.5% 42.9%12 EGYPT 42 50 65 83 1.4% 27.7%13 MALAYSIA 50 58 67 72 1.2% 7.5%14 PORTUGAL 60 64 66 69 1.2% 4.5%15 RUSSIA 25 30 45 58 1.0% 28.9%16 USA 59 60 55 58 1.0% 5.5%17 SOUTH KOREA 39 48 50 56 0.9% 12.0%18 GERMANY 64 62 57 54 0.9% -5.3%19 JAPAN 54 54 53 51 0.9% -3.8%20 POLAND 30 35 46 49 0.8% 6.5%21 UAE 30 40 40 48 0.8% 20.0%22 FRANCE 50 49 44 41 0.7% -6.8%23 TAIWAN 88 68 45 37 0.6% -17.8%24 MOROCCO 23 30 35 35 0.6% 0.0%25 ALGERIA 30 30 30 30 0.5% 0.0%26 CZECH REPUBLIC 27 30 30 29 0.5% -3.3%27 COLOMBIA 25 26 26 26 0.4% 0.0%28 PHILIPPINES 22 25 25 25 0.4% 0.0%29 SOUTH AFRICA 9 15 15 20 0.3% 33.3%30 TUNISIA 15 15 17 19 0.3% 11.8%TOTAL 4,632 4,887 5,142 5,726 97.0%TOTAL WORLD PRODUCTION 4,841 5,107 5,348 5,904 100.0THE 30 MAJOR MANUFACTURING COUNTRIES COVER ALMOST 97.0% OF WORLD PRODUCTIONtiletoday.com.au ISSUE 4229