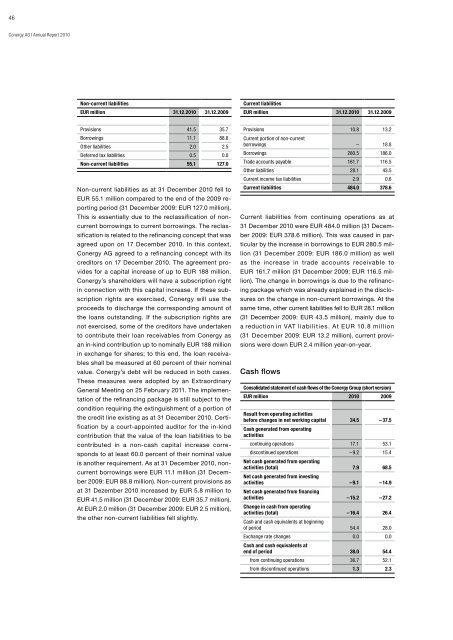
46<strong>Conergy</strong> <strong>AG</strong> I <strong>Annual</strong> Report 2010Non-current liabilitiesEUR million 31.12.2010 31.12.2009Current liabilitiesEUR million 31.12.2010 31.12.2009Provisions 41.5 35.7Borrowings 11.1 88.8Other liabilities 2.0 2.5Deferred tax liabilities 0.5 0.0Non-current liabilities 55.1 127.0Non-current liabilities as at 31 December 2010 fell toEUR 55.1 million compared to the end of the 2009 reportingperiod (31 December 2009: EUR 127.0 million).This is essentially due to the reclassification of noncurrentborrowings to current borrowings. The reclassificationis related to the refinancing concept that wasagreed upon on 17 December 2010. In this context,<strong>Conergy</strong> <strong>AG</strong> agreed to a refinancing concept with itscreditors on 17 December 2010. The agreement providesfor a capital increase of up to EUR 188 million.<strong>Conergy</strong>’s shareholders will have a subscription rightin connection with this capital increase. If these subscriptionrights are exercised, <strong>Conergy</strong> will use theproceeds to discharge the corresponding amount ofthe loans outstanding. If the subscription rights arenot exercised, some of the creditors have undertakento contribute their loan receivables <strong>from</strong> <strong>Conergy</strong> asan in-kind contribution up to nominally EUR 188 millionin exchange for shares; to this end, the loan receivablesshall be measured at 60 percent of their nominalvalue. <strong>Conergy</strong>’s debt will be reduced in both cases.These measures were adopted by an ExtraordinaryGeneral Meeting on 25 February 2011. The implementationof the refinancing package is still subject to thecondition requiring the extinguishment of a portion ofthe credit line existing as at 31 December 2010. Certificationby a court-appointed auditor for the in-kindcontribution that the value of the loan liabilities to becontributed in a non-cash capital increase correspondsto at least 60.0 percent of their nominal valueis another requirement. As at 31 December 2010, noncurrentborrowings were EUR 11.1 million (31 December2009: EUR 88.8 million). Non-current provisions asat 31 Dezember 2010 increased by EUR 5.8 million toEUR 41.5 million (31 December 2009: EUR 35.7 million).At EUR 2.0 million (31 December 2009: EUR 2.5 million),the other non-current liabilities fell slightly.Provisions 10.8 13.2Current portion of non-currentborrowings – 18.8Borrowings 280.5 186.0Trade accounts payable 161.7 116.5Other liabilities 28.1 43.5Current income tax liabilities 2.9 0.6Current liabilities 484.0 378.6Current liabilities <strong>from</strong> continuing operations as at31 December 2010 were EUR 484.0 million (31 December2009: EUR 378.6 million). This was caused in particularby the increase in borrowings to EUR 280.5 million(31 December 2009: EUR 186.0 million) as wellas the increase in trade accounts receivable toEUR 161.7 million (31 December 2009: EUR 116.5 million).The change in borrowings is due to the refinancingpackage which was already explained in the disclosureson the change in non-current borrowings. At thesame time, other current liabilities fell to EUR 28.1 million(31 December 2009: EUR 43.5 million), mainly due toa reduction in VAT liabilities. At EUR 10.8 million(31 December 2009: EUR 13.2 million), current provisionswere down EUR 2.4 million year-on-year.Cash flowsConsolidated statement of cash flows of the <strong>Conergy</strong> Group (short version)EUR million 2010 2009Result <strong>from</strong> operating activitiesbefore changes in net working capital 34.5 – 37.5Cash generated <strong>from</strong> operatingactivitiescontinuing operations 17.1 53.1discontinued operations – 9.2 15.4Net cash generated <strong>from</strong> operatingactivities (total) 7.9 68.5Net cash generated <strong>from</strong> investingactivities – 9.1 – 14.9Net cash generated <strong>from</strong> financingactivities – 15.2 – 27.2Change in cash <strong>from</strong> operatingactivities (total) – 16.4 26.4Cash and cash equivalents at beginningof period 54.4 28.0Exchange rate changes 0.0 0.0Cash and cash equivalents atend of period 38.0 54.4<strong>from</strong> continuing operations 36.7 52.1<strong>from</strong> discontinued operations 1.3 2.3
47Top quality – <strong>from</strong> a <strong>single</strong> <strong>source</strong>Management Board and Supervisory BoardAssets, Liabilities, Cash Flows, P & L |Group Management ReportConsolidated Financial StatementsFurther InformationThe statement of cash flows describes the <strong>source</strong> andutilisation of the cash flows in the reporting period.Hence it is central to the assessment of the changes inthe Company’s financial position.Based on operating income (EBIT) of EUR – 13.8 millionin the 2010 financial year (2009: EUR – 36.8 million),adjusted for non-cash items such as depreciation,amortisation and impairment losses, changes in noncurrentprovisions as well as other non-cash incomeand expenses such as, for instance, portions of the netgain/loss <strong>from</strong> currency translation, and writedownsof inventories and receivables, the cash flow <strong>from</strong> operatingactivities before changes in net working capital(gross cash flow) increased considerably to EUR 34.5million year on year (2009: EUR – 37.5 million).At EUR 17.1 million, the cash flow generated in the2010 financial year <strong>from</strong> operating activities related tocontinuing operations was EUR 36.0 million lower yearon-year(2009: EUR 53.1 million), especially due to theoutflow of EUR 22.8 million in funds <strong>from</strong> the increasein working capital despite the major improvement ingross cash flow. In contrast, there had been an inflowof EUR 97.9 million in related funds the previous year.The increase in the working capital stems in particular<strong>from</strong> the relatively large increase in inventories ofEUR 73.3 million (2009: decrease in inventories ofEUR 89.6 million). At the same time, trade accountspayable rose by EUR 41.8 million (2009: EUR 17.6 million).Trade accounts receivable rose by EUR 9.3 millionin the same period the previous year but fell by EUR 8.7million in the 2010 financial year. The other net assetschanged by EUR 4.9 million (2009: EUR – 9.9 million).Tax refunds in the 2010 financial year were EUR 0.5 million(2009: EUR 2.6 million).The cash flow <strong>from</strong> operating activities related to thediscontinued operations of the EPURON segment –bio mass, biogas, wind energy projects and CSP – inthe 2010 financial year was EUR – 9.2 million (2009:EUR 15.4 million). This figure is shown in a separateitem in the statement of cash flows. Overall, the cash inflow<strong>from</strong> operating activities amounted to EUR 7.9 million(2009: EUR 68.5 million).In the first 2010 financial year, EUR 9.1 million in net cashwere used for investing activities (2009: EUR 14.9 million).The Group invested a net total of EUR 14.6 million (prioryearperiod: EUR 12.3 million) in property, plant and equipmentas well as intangible assets. The inflow of funds <strong>from</strong>financial assets was EUR 4.2 million (2009: outflow ofEUR 3.4 million). The <strong>Conergy</strong> Group received interestpayments of EUR 0.9 million (2009: EUR 0.8 million).The <strong>Conergy</strong> Group’s net cash flow <strong>from</strong> financingactivities in the 2010 financial was EUR – 15.2 million(2009: EUR – 27.2 million). This net cash outflow is theresult of new borrowings of EUR 22.4 million (2009:EUR 48.7 million) under the syndicated loan and the repaymentof borrowings in the amount of EUR 20.7 million(2009: EUR 55.5 million). This concerned a partial paymentin the first quarter under the syndicated loan thatwas used to finance the solar factory in Frankfurt (Oder).We also made a separate payment of EUR 1.9 millionin August 2010. Add to that interest payments ofEUR 16.9 million, which were down year-on-year (2009:EUR 20.4 million).The net change in cash and cash equivalents in thefirst 2010 financial year was therefore EUR – 16.4 million(2009: EUR 26.4 million).Cash and cash equivalents and net liabilitiesThe <strong>Conergy</strong> Group had cash and cash equivalents ofEUR 36.7 million as at 31 December 2010 (31 December2009: EUR 52.1 million).As at 31 December 2010, borrowings amounted toEUR 291.6 million, compared to EUR 293.6 million atthe close of the 2009 financial year. The Group’s netliabilities as at the end of the 2010 financial yearthus were EUR 254.9 million (31 December 2009:EUR 241.5 million).Net liabilities and gearing 31.12.2010 31.12.2009Non-current borrowings EUR million 11.1 88.8Current borrowings EUR million 280.5 204.8Borrowings EUR million 291.6 293.6Cash and cashequivalents EUR million 36.7 52.1Net liabilities related tocontinuing operations EUR million 254.9 241.5Equity EUR million 71.4 116.0Gearing in percent 357.0 208.2As a result, the gearing ratio, i.e. the ratio of net borrowings(borrowings less liquid funds) to equity as at31 December 2010 increased to 357.0 percent (31 December2009: 208.2 percent). The development of gearingagainst a backdrop of slightly higher net liabilitiesis essentially due to the reduction in equity as a resultof the loss incurred in the 2010 financial year.In a deviation <strong>from</strong> the presentation in the consolidatedbalance sheet, the cash holdings shown in the statementof cash flows as at 31 December 2010 containEUR 1.3 million in cash and cash equivalents attribut-