Exploratory Data Analysis with MATLAB
Exploratory Data Analysis with MATLAB
Exploratory Data Analysis with MATLAB

Create successful ePaper yourself
Turn your PDF publications into a flip-book with our unique Google optimized e-Paper software.
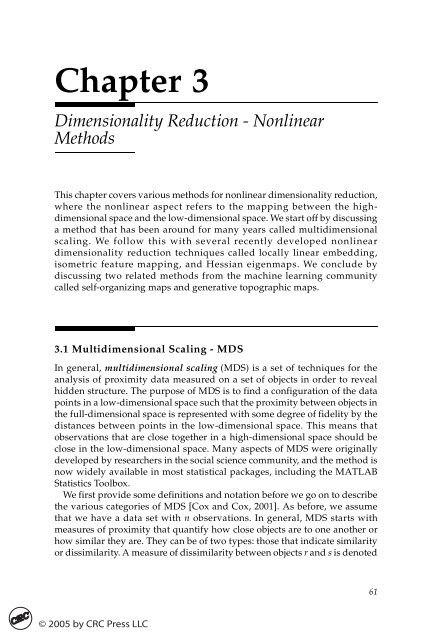
Chapter 3Dimensionality Reduction - NonlinearMethodsThis chapter covers various methods for nonlinear dimensionality reduction,where the nonlinear aspect refers to the mapping between the highdimensionalspace and the low-dimensional space. We start off by discussinga method that has been around for many years called multidimensionalscaling. We follow this <strong>with</strong> several recently developed nonlineardimensionality reduction techniques called locally linear embedding,isometric feature mapping, and Hessian eigenmaps. We conclude bydiscussing two related methods from the machine learning communitycalled self-organizing maps and generative topographic maps.3.1 Multidimensional Scaling - MDSIn general, multidimensional scaling (MDS) is a set of techniques for theanalysis of proximity data measured on a set of objects in order to revealhidden structure. The purpose of MDS is to find a configuration of the datapoints in a low-dimensional space such that the proximity between objects inthe full-dimensional space is represented <strong>with</strong> some degree of fidelity by thedistances between points in the low-dimensional space. This means thatobservations that are close together in a high-dimensional space should beclose in the low-dimensional space. Many aspects of MDS were originallydeveloped by researchers in the social science community, and the method isnow widely available in most statistical packages, including the <strong>MATLAB</strong>Statistics Toolbox.We first provide some definitions and notation before we go on to describethe various categories of MDS [Cox and Cox, 2001]. As before, we assumethat we have a data set <strong>with</strong> n observations. In general, MDS starts <strong>with</strong>measures of proximity that quantify how close objects are to one another orhow similar they are. They can be of two types: those that indicate similarityor dissimilarity. A measure of dissimilarity between objects r and s is denoted61
62 <strong>Exploratory</strong> <strong>Data</strong> <strong>Analysis</strong> <strong>with</strong> <strong>MATLAB</strong>by δ rs , and the similarity is denoted by s rs . For most definitions of theseproximity measures, we haveandδ rs ≥ 0 δ rr = 00 ≤s rs ≤1s rr = 1 .Thus, we see that for a dissimilarity measure δ rs , small values correspond toobservations that are close together, while the opposite is true for similaritymeasures s rs . These two main types of proximity measures are easilyconverted into the other one when necessary (see Appendix A for moreinformation on this issue). Thus, for the rest of this chapter, we will assumethat proximity measures dissimilarity between objects. We also assume that thedissimilarities are arranged in matrix form, which will be denoted by ∆. Inmany cases, this will be a symmetric n x n matrix (sometimes given in eitherlower or upper triangular form).In the lower-dimensional space, we denote the distance betweenobservation r and s by d rs . It should also be noted that in the MDS literaturethe matrix of coordinate values in the lower-dimensional space is denoted by X.We follow that convention here, knowing that it might be rather confusing<strong>with</strong> our prior use of X as representing the original set of n p-dimensionalobservations.In MDS, one often starts <strong>with</strong> or might only have the dissimilarities ∆, notthe original observations. In fact, in the initial formulations of MDS, theexperiments typically involved qualitative judgements about differencesbetween subjects, and p-dimensional observations do not make sense in thatcontext. So, to summarize, <strong>with</strong> MDS we start <strong>with</strong> dissimilarities ∆ and endup <strong>with</strong> d-dimensional 1 transformed observations X. Usually, d = 2 or d = 3 ischosen to allow the analyst to view and explore the results for interestingstructure, but any d < p is also appropriate.There are many different techniques and flavors of MDS, most of which fallinto two main categories: metric MDS and nonmetric MDS. The maincharacteristic that divides them arises from the different assumptions of howthe dissimilarities δ rs are transformed into the configuration of distances d rs[Cox and Cox, 2001]. Metric MDS assumes that the dissimilarities δ rscalculated from the p-dimensional data and distances d rs in a lowerdimensionalspace are related as followsd rs≈f( δ rs ), (3.1)1We realize that the use of the notation d as both the lower dimensionality of the data (d < p) andthe distance d rs between points in the configuration space might be confusing. However, themeaning should be clear from the context.
Dimensionality Reduction - Nonlinear Methods 63where f is a continuous monotonic function. The form of f(•) specifies theMDS model. For example, we might use the formulaf( δ rs ) = bδ rs. (3.2)Mappings that follow Equation 3.2 are called ratio MDS [Borg and Groenen,1997]. Another common choice is interval MDS, <strong>with</strong> f(•) given byf( δ rs ) = a + bδ rs ,where a and b are free parameters. Other possibilities include higher degreepolynomials, logarithmic, and exponential functions.Nonmetric MDS relaxes the metric properties of f(•) and stipulates onlythat the rank order of the dissimilarities be preserved. The transformation orscaling function must obey the monotonicity constraint:δ rs< δ ab ⇒ f ( δ rs ) ≤ f ( δ ab ) ,for all objects. Because of this, nonmetric MDS is also known as ordinal MDS.Metric 3.1.1 MDSMost of the methods in metric MDS start <strong>with</strong> the fact that we seek atransformation that satisfies Equation 3.1. We can tackle this problem bydefining an objective function and then using a method that will optimize it.One way to define the objective function is to use the squared discrepanciesbetween d rs and f( δ rs ) as follows⎛ ( f ( δ rs )–d rs ) 2 ⎞⎝∑∑⎠r s-------------------------------------------------- . (3.3)scale factorIn general, Equation 3.3 is called the stress; different forms for the scale factorgive rise to different forms of stress and types of MDS. The scale factor usedmost often is∑∑rsin which case, we have an expression called Stress-1 [Kruskal, 1964a]. Thesummation is taken over all dissimilarities, skipping those that are missing.2d rs,
64 <strong>Exploratory</strong> <strong>Data</strong> <strong>Analysis</strong> <strong>with</strong> <strong>MATLAB</strong>As we stated previously, sometimes the dissimilarities are symmetric, inwhich case, we only need to sum over 1 = r < s = n.Thus, in MDS, we would scale the dissimilarities using f(•) and then find aconfiguration of points in a d-dimensional space such that when we calculatethe distances between them the stress is minimized. This can now be solvedusing numerical methods and operations research techniques (e.g., gradientor steepest descent). These methods are usually iterative and are notguaranteed to find a global solution to the optimization problem. We willexpand on some of the details later, but first we describe a case where a closedform solution is possible.The phrase metric multidimensional scaling is often used in the literature torefer to a specific technique called classical MDS. However, metric MDSincludes more than this one technique, such as least squares scaling andothers [Cox and Cox, 2001]. For metric MDS approaches, we first describeclassical MDS followed by a method that optimizes a loss function using amajorization technique.Classical MDSIf the proximity measure in the original space and the distance are taken tobe Euclidean, then a closed form solution exists to find the configuration ofpoints in a d-dimensional space. This is the classical MDS approach. Thefunction f(•) relating dissimilarities and distances is the identity function, sowe seek a mapping such thatd rs=δ rs.This technique originated <strong>with</strong> Young and Householder [1938], Torgerson[1952], and Gower [1966]. Gower was the one that showed the importance ofclassical scaling, and he gave it the name principal coordinates analysis,because it uses ideas similar to those in PCA. Principal coordinate analysisand classical scaling are the same thing, and they have become synonymous<strong>with</strong> metric scaling.We now describe the steps of the method only, <strong>with</strong>out going into thederivation. Please see any of the following for the derivation of classicalMDS: Cox and Cox [2001], Borg and Groenen [1997], or Seber [1984].- Classical MDSProcedure1. Using the matrix of dissimilarities, ∆, find matrix Q, where eachelement of Q is given by2q rs = –1 .2 --δ rs
Dimensionality Reduction - Nonlinear Methods 652. Find the centering matrix H usingH = I – n 1– 11 Twhere I is the x n n identity matrix, and 1 is a vector of n ones.3. Find the matrix B, as follows,B=HQH.4. Determine the eigenvectors and eigenvalues of B:B=ALA T.5. The coordinates in the lower-dimensional space are given by1 ⁄ 2X = A d L dwhere A d contains the eigenvectors corresponding to the d largest1 ⁄ 2eigenvalues, and L d contains the square root of the d largesteigenvalues along the diagonal.We use similar ideas from PCA to determine the dimensionality d to use inStep 5 of the algorithm. Although, d = 2 is often used in MDS, since the datacan then be represented in a scatterplot.For some data sets, the matrix B might not be positive semi-definite, inwhich case some of the eigenvalues will be negative. One could ignore thenegative eigenvalues and proceed to step 5 or add an appropriate constant tothe dissimilarities to make B positive semi-definite. We do not address thissecond option here, but the reader is referred to Cox and Cox [2001] for moredetails. If the dissimilarities are in fact Euclidean distances, then this problemdoes not arise.Since this uses the decomposition of a square matrix, some of the propertiesand issues discussed about PCA are applicable here. For example, the lowerdimensionalrepresentations are nested. The first two dimensions of the 3-Dcoordinate representation are the same as the 2-D solution. It is alsointeresting to note that PCA and classical MDS provide equivalent resultswhen the dissimilarities are Euclidean distances [Cox and Cox, 2001].,Example 3.1For this example, we use the BPM data described in Chapter 1. Recall that oneof the applications for these data is to discover different topics or sub-topics.For ease of discussion and presentation, we will look at only two of the topicsin this example: the comet falling into Jupiter (topic 6) and DNA in the O. J.
66 <strong>Exploratory</strong> <strong>Data</strong> <strong>Analysis</strong> <strong>with</strong> <strong>MATLAB</strong>Simpson trial (topic 9). First, using the match distances, we extract therequired observations from the full interpoint distance matrix.% First load the data - use the 'match' interpoint% distance matrix.load matchbpm% Now get the data for topics 9 and 6.% Find the indices where they are not equal to 6 or 9.indlab = find(classlab ~= 6 & classlab ~=9);% Now get rid of these from the distance matrix.matchbpm(indlab,:) = [];matchbpm(:,indlab) = [];classlab(indlab) = [];The following piece of code shows how to implement the steps for classicalMDS in <strong>MATLAB</strong>.% Now implement the steps for classical MDS% Find the matrix Q:Q = -0.5*matchbpm.^2;% Find the centering matrix H:n = 73;H = eye(n) - ones(n)/n;% Find the matrix B:B = H*Q*H;% Get the eigenvalues of B.[A,L] = eig(B);% Find the ordering largest to smallest.[vals, inds] = sort(diag(L));inds = flipud(inds);vals = flipud(vals);% Re-sort based on these.A = A(:,inds);L = diag(vals);We are going to plot these results using d = 2 for ease of visualization, but wecan also construct a scree-type plot to look for the ‘elbow’ in the curve. As inPCA, this can help us determine a good value to use. The code forconstructing this plot and finding the coordinates in a 2-D space is given next.% First plot a scree-type plot to look for the elbow.% The following uses a log scale on the y-axis.semilogy(vals(1:10),'o')% Using 2-D for visualization purposes,% find the coordinates in the lower-dimensional space.X = A(:,1:2)*diag(sqrt(vals(1:2)));% Now plot in a 2-D scatterplotind6 = find(classlab == 6);
Dimensionality Reduction - Nonlinear Methods 6710 5.1 Log−Scree Plotlog Eigenvalues10 5.09910 5.0980 1 2 3 4 5 6 7 8 9 10 11d150100Topic 6Topic 9MDS Dimension 2500−50−100−80 −60 −40 −20 0 20 40 60 80 100 120MDS Dimension 1FIGURE 3.1The top plot shows the logarithm of the eigenvalues. The bottom plot is a scatterplot of the2-D coordinates after classical MDS. Note the good separation between the two topics, aswell as the appearance of sub-topics for topic 6.
68 <strong>Exploratory</strong> <strong>Data</strong> <strong>Analysis</strong> <strong>with</strong> <strong>MATLAB</strong>ind9 = find(classlab == 9);plot(X(ind6,1),X(ind6,2),'x',X(ind9,1),X(ind9,2),'o')legend({'Topic 6';'Topic 9'})The scree plot is shown in Figure 3.1 (top), where we see that the elbow looksto be around d = 3. The scatterplot of the 2-D coordinates is given in Figure3.1 (bottom). We see clear separation between topics 6 and 9. However, it isalso interesting to note that there seems to be several sub-topics in topic 6.❑<strong>MATLAB</strong> provides a function called cmdscale for constructing lowerdimensionalcoordinates using classical MDS. This is available in theStatistics Toolbox.Metric MDS - SMACOFThe general idea of the majorization method for optimizing a function is asfollows. Looking only at the one-dimensional case, we want to minimize acomplicated function f(x) by using a function g(x , y) that is easily minimized.The function g has to satisfyfor a given y such thatf( x) ≤ gx ( , y),f( y) = gy ( , y).Looking at graphs of these function one would see that the function g isalways above f, and they coincide at the point x = y. The method ofminimizing f is iterative. We start <strong>with</strong> an initial value x 0 , and we minimizeg(x , x 0 ) to get x 1 . We then minimize g(x , x 1 ) to get the next value, continuingin this manner until convergence. Upon convergence of the algorithm, wewill also have minimized f(x).The SMACOF (Scaling by Majorizing a Complicated Function) methodgoes back to de Leeuw [1977], and others have refined it since then, includingGroenen [1993]. The method is simple, and it can be used for both metric andnonmetric applications. We now follow the notation of Borg and Groenen[1997] to describe the algorithm for the metric case. They show that theSMACOF algorithm satisfies the requirements for minimizing a functionusing majorization, as described above. We leave out the derivation, butthose who are interested in this and in the nonmetric case can refer to theabove references as well as Cox and Cox [2001].The raw stress is written as
Dimensionality Reduction - Nonlinear Methods 69for all available dissimilarities . The inequality r < s in the summationmeans that we only sum over half of the data, since we are assuming that thedissimilarities and distances are symmetric. We might have some missingvalues, so we define a weight w rs <strong>with</strong> a value of 1 if the dissimilarity ispresent and a value of 0 if it is missing. The notation d rs (X) makes it explicitthat the distances are a function of X (d-dimensional transformedobservations), and that we are looking for a configuration X that minimizesstress.Before we describe the algorithm, we need to present some relationshipsand notation. Let Z be a possible configuration of points. The matrix V haselements given by the followingand∑σ( X) = w rs ( d rs ( X) – δ rs ) 2=r < s∑r < s2w rs δ rs+ ∑w rs d 2( rs X ) – 2 ∑w rs δ rs d rs ( X),r < sδ rsv ij = – w ij , i ≠ jr < sv ii=n∑j = 1,i≠jw ij.This matrix is not of full rank, and we will need the inverse in one of theupdate steps. So we turn to the Moore-Penrose inverse, which will bedenoted by V + . 2We next define matrix B(Z) <strong>with</strong> elementsb ij⎧ w ij δ ij⎪– -------------- dd ij ( Z)ij ( Z) ≠ 0= ⎨, i ≠ j⎪⎩0 d ij ( Z) = 0andb ii= –n∑j = 1,j ≠ ib ij.2The Moore-Penrose inverse is also called the pseudoinverse and can be computed using thesingular value decomposition. <strong>MATLAB</strong> has a function called pinv that provides this inverse.
70 <strong>Exploratory</strong> <strong>Data</strong> <strong>Analysis</strong> <strong>with</strong> <strong>MATLAB</strong>We are now ready to define the Guttman transform. The general form ofthe transform is given byX k=V + B(Z)Z ,where the k represents the iteration number in the algorithm. If all of theweights are one (none of the dissimilarities are missing), then the transformis much simpler:X k = n – 1BZ ( )Z .The SMACOF algorithm is outlined below.AlgorithmSMACOF1. Find an initial configuration of points in R d . This can either berandom or nonrandom (i.e., some regular grid). Call this X 0 .2. Set Z = X 0 and the counter to k = 0.3. Compute the raw stress σ ( X 0 ).4. Increase the counter by 1: k = k + 1.5. Obtain the Guttman transform X k .6. Compute the stress for this iteration, σ ( X k).7. Find the difference in the stress values between the two iterations.If this is less than some pre-specified tolerance or if the maximumnumber of iterations has been reached, then stop.8. Set Z = X k, and go to step 4.We illustrate this algorithm in the next example.Example 3.2We turn to a different data set for this example and look at the leukemiadata. Recall that we can look at either genes or patients as our observations;in this example we will be looking at the genes. To make things easier, weonly implement the case where all the weights are 1, but the more generalsituation is easily implemented using the above description. First we load thedata and get the distances.% Use the Leukemia data, using the genes (columns)% as the observations.load leukemiay = leukemia';% Get the interpoint distance matrix.% pdist gets the interpoint distances.
Dimensionality Reduction - Nonlinear Methods 71% squareform converts them to a square matrix.D = squareform(pdist(y,'seuclidean'));[n,p] = size(D);% Turn off this warning... :warning off <strong>MATLAB</strong>:divideByZeroNext we get the required initial configuration and the stress associated <strong>with</strong>it.% Get the first term of stress.% This is fixed - does not depend on the configuration.stress1 = sum(sum(D.^2))/2;% Now find an initial random configuration.d = 2;% Part of Statistics ToolboxZ = unifrnd(-2,2,n,d);% Find the stress for this.DZ = squareform(pdist(Z));stress2 = sum(sum(DZ.^2))/2;stress3 = sum(sum(D.*DZ));oldstress = stress1 + stress2 - stress3;Now we iteratively adjust the configuration until the stress converges.% Iterate until stress converges.tol = 10^(-6);dstress = realmax;numiter = 1;dstress = oldstress;while dstress > tol & numiter
72 <strong>Exploratory</strong> <strong>Data</strong> <strong>Analysis</strong> <strong>with</strong> <strong>MATLAB</strong>A scatterplot of the resulting configuration is shown in Figure 3.2, <strong>with</strong> twodifferent ways to classify the data. We see that some clustering is visible.❑Nonmetric 3.1.2 MDSAn algorithm for solving the nonmetric MDS problem was first discussed byShepard [1962a, 1962b]. However, he did not introduce the idea of using aloss function. That came <strong>with</strong> Kruskal [1964a, 1964b] who expanded the ideasof Shepard and gave us the concept of minimizing a loss function calledstress.Not surprisingly, we first introduce some more notation and terminologyfor nonmetric MDS. The disparity is a measure of how well the distance d rsmatches the dissimilarity δ rs . We represent the disparity as dˆ rs . The r-th pointin our configuration X will have coordinatesx r = ( x r1 , … , x rd ) T.We will use the Minkowski dissimilarity to measure the distance betweenpoints in our d-dimensional space. It is defined asd∑d rs = x ri – x sii = 1λ1 ⁄ λ,where λ > 0. See Appendix A for more information on this distance and theparameter λ.We can view the disparities as a function of the distance, such asdˆ rs= f( d rs ),whereδ rs< ⇒ dˆ r s ≤ dˆ abδ ab.Thus, the order of the original dissimilarities is preserved by the disparities.Note that this condition allows for possible ties in the disparities.We define a loss function L, which is really stress, as follows
Dimensionality Reduction - Nonlinear Methods 73105B−cellT−cellNA0−5−10−15−20 −15 −10 −5 0 5 10 1510ALLAML50−5−10−15−20 −15 −10 −5 0 5 10 15FIGURE 3.2Here we show the results of using the SMACOF algorithm on the leukemia data set. Thetop panel shows the data transformed to 2-D and labeled by B-cell and T-cell. The lower panelillustrates the same data using different symbols based on the ALL or AML labels. There issome indication of being able to group the genes in a reasonable fashion.
74 <strong>Exploratory</strong> <strong>Data</strong> <strong>Analysis</strong> <strong>with</strong> <strong>MATLAB</strong>L∑r < s( – ) 2d rsdˆ rs= S = -------------------------------- =∑r < s2d rsS *-----T *.It could be the case that we have missing dissimilarities or the values mightbe meaningless for some reason. If the analyst is faced <strong>with</strong> this situation,then the summations in the definition of stress are restricted to those pairs(r,s) for which the dissimilarity is available.As <strong>with</strong> other forms of MDS, we seek a configuration of points X, such thatthe stress is minimized. Note that the coordinates of the configuration enterinto the loss function through the distances d rs . The original dissimilaritiesenter into the stress by imposing an ordering on the disparities. Thus, thestress is minimized subject to the constraint on the disparities. This constraintis satisfied by using isotonic regression (also known as monotone regression) 3to obtain the disparities.We now pause to describe the isotonic regression procedure. This was firstdescribed in Kruskal [1964b], where he developed an up-and-down-blocksalgorithm. A nice explanation of this is given in Borg and Groenen [1997], aswell as in the original paper by Kruskal. We choose to describe andimplement the method for isotonic regression outlined in Cox and Cox[2001]. Isotonic regression of the d rs on the δ rs partitions the dissimilarities intoblocks over which the dˆ rs are constant. The estimated disparities dˆ rs aregiven by the mean of the d rs values <strong>with</strong>in the block.Example 3.3The easiest way to explain (and hopefully to understand) isotonic regressionis through an example. We use a simple one given in Cox and Cox [2001].There are four objects <strong>with</strong> the following dissimilaritiesδ 12 = 2.1, δ 13 = 3.0, δ 14 = 2.4, δ 23 = 1.7, δ 24 = 3.9, δ 34 = 3.2 .A configuration of points yields the following distancesd 12 = 1.6, d 13 = 4.5, d 14 = 5.7, d 23 = 3.3, d 24 = 4.3, d 34 = 1.3 .We now order the dissimilarities from smallest to largest and use a singlesubscript to denote the rank. We also impose the same order (and subscript)on the corresponding distances. This yields3This is also known as monotonic least squares regression.
Dimensionality Reduction - Nonlinear Methods 75δ 1 = 1.7, δ 2 = 2.1, δ 3 = 2.4, δ 4 = 3.0, δ 5 = 3.2, δ 6 = 3.9d 1 = 3.3, d 2 = 1.6, d 3 = 5.7, d 4 = 4.5, d 5 = 1.3, d 6 = 4.3.The constraint on the disparities requires these distances to be ordered suchthat d i < d i+1 . If this is what we have from the start, then we need not adjustthings further. Since that is not true here, we must use isotonic regression toget . To do this, we first get the cumulative sums of the distances d i definedasdˆ rsD i d j ,= i = 1 , … , N ,j = 1where N is the total number of dissimilarities available. In essence, thealgorithm finds the greatest convex minorant of the graph of D i , goingthrough the origin. See Figure 3.3 for an illustration of this. We can think ofthis procedure as taking a string, attaching it to the origin on one end and thelast point on the other end. The points on the greatest convex minorant arethose where the string touches the points D i . These points partition thedistances d i into blocks, over which we will have disparities of constant value.These disparities are the average of the distances that fall into the block. Coxand Cox [2001] give a proof that this method yields the required isotonicregression. We now provide some <strong>MATLAB</strong> code that illustrates these ideas.% Enter the original data.dissim = [2.1 3 2.4 1.7 3.9 3.2];dists = [1.6 4.5 5.7 3.3 4.3 1.3];N = length(dissim);% Now re-order the dissimilarities.[dissim,ind] = sort(dissim);% Now impose the same order on the distances.dists = dists(ind);% Now find the cumulative sums of the distances.D = cumsum(dists);% Add the origin as the first point.D = [0 D];It turns out that we can find the greatest convex minorant by finding theslope of each D i <strong>with</strong> respect to the origin. We first find the smallest slope,which defines the first partition (i.e., it is on the greatest convex minorant).We then find the next smallest slope, after removing the first partition fromfurther consideration. We continue in this manner until we reach the end ofthe points. The following code implements this process.% Now find the slope of these.slope = D(2:end)./(1:N);i∑
76 <strong>Exploratory</strong> <strong>Data</strong> <strong>Analysis</strong> <strong>with</strong> <strong>MATLAB</strong>% Find the points on the convex minorant by looking% for smallest slopes.i = 1;k = 1;while i
Dimensionality Reduction - Nonlinear Methods 772520Cumulative SumGreatest Convex Minorant15D i10500 1 2 3 4 5 6iFIGURE 3.3This shows the idea behind isotonic regression using the greatest convex minorant. Thegreatest convex minorant is given by the dashed line. The places where it touches the graphof the cumulative sums of the distances partition the distances into blocks. Each of thedisparities in the blocks are given by the average of the distances falling in that partition.- Kruskal’s AlgorithmProcedure1. Choose an initial configuration X 0 for a given dimensionality d. Setthe iteration counter k equal to 0. Set the step size α to some desiredstarting value.2. Normalize the configuration to have mean of zero (i.e., centroid isat the origin) and a mean square distance from the origin equal to 1.3. Compute the interpoint distances for this configuration.4. Check for equal dissimilarities. If some are equal, then order thosesuch that the corresponding distances form an increasing sequence<strong>with</strong>in that block.5. Find the disparities dˆ rs using the current configuration of pointsand isotonic regression.6. Append all of the coordinate points into one vector such thatx = ( x 11 , … , x 1d , … , x n1 , … , x nd ) T.7. Compute the gradient for the k-th iteration given by
78 <strong>Exploratory</strong> <strong>Data</strong> <strong>Analysis</strong> <strong>with</strong> <strong>MATLAB</strong>∂S-------- g ui S ( δ ur – δ us) d rs – dˆ rs= =------------------∂x ui∑r < sS *---------------------------- x ri – x sisgn( x – x ),ri siwhere δ ur represents the Kronecker delta function, not dissimilarities.This function is defined as followsδ ur = 1 if u = r–d----- rsT *λ – 1d rsλ – 1δ ur = 0 if u ≠ rThe value of the sgn(•) function is +1, if the argument is positiveand –1 if it is negative.8. Check for convergence. Determine the magnitude of the gradientvector for the current configuration usingmag( g k )=1 2-- g .n ∑ kuiu,iIf this magnitude is less than some small value ε or if somemaximum allowed number of iterations has been reached, then theprocess stops.9. Find the step size αα k = α k – 1 × angle factor × relaxation factor × good luck factor ,where k represents the iteration number and⎛g krs g⎞⎜ ∑ k – 1rs⎟( cos θ) angle factor = 43r < s<strong>with</strong> ⎜cosθ = ------------------------------------------- ⎟⎜⎟⎜∑ g 2krs ∑ g 2k –⎝1rs⎟⎠relaxation factorgood luck factor = min 1, --------- .10. The new configuration is given byr < sr < sS k1.3= ------------- <strong>with</strong> ⎛β = min 1,----------- ⎞1 + β 5 ⎝S k – 5⎠S kS k – 1+ = x k – α k-------------------.mag( g k )x k 1g k
Dimensionality Reduction - Nonlinear Methods 7911. Increment the counter: k = k + 1. Go to step 2.A couple of programming issues should be noted. When we are in thebeginning of the iterative algorithm, we will not have values of the stress fork – 5 or k – 1 (needed in Step 9). In these cases, we will simply use the valueat the first iteration until we have enough. We can use a similar idea for thegradient. Kruskal [1964b] states that this step size provides large steps duringthe initial iterations and small steps at the end. There is no claim of optimality<strong>with</strong> this procedure, and the reader should be aware that the finalconfiguration is not guaranteed to be a global solution. It is likely that theconfiguration will be a local minimum for stress, which is typically the casefor greedy iterative algorithms. It is recommended that several differentstarting configurations be used, and the one <strong>with</strong> the minimum stress beaccepted as the final answer.This leads to another programming point. How do we find an initialconfiguration to start the process? We could start <strong>with</strong> a grid of points thatare evenly laid out over a d-dimensional space. Another possibility is to startfrom the configuration given by classical MDS. Finally, one could alsogenerate random numbers according to a Poisson process in R d .Another issue that must be addressed <strong>with</strong> nonmetric MDS is how tohandle ties in the dissimilarities. There are two approaches to this. Theprimary approach states that if δ rs = δ tu , then dˆ rs is not required to be equal todˆ tu . The secondary and more restrictive approach requires the disparities tobe equal when dissimilarities are tied. We used the primary approach in theabove procedure and in our <strong>MATLAB</strong> implementation.Example 3.4The nmmds function (included in the EDA Toolbox) that implementsKruskal’s nonmetric MDS is quite long, and it involves several helperfunctions. So, we just show how it would be used rather than repeating all ofthe code here. We return to our BPM data, but this time we will look at twodifferent topics: topic 8 (the death of the North Korean leader) and topic 11(Hall’s helicopter crash in North Korea). Since these are both about NorthKorea, we would expect some similarity between them. Previousexperiments showed that the documents from these two topics were alwaysgrouped together, but in several sub-groups [Martinez, 2002]. We apply thenonmetric MDS method to these data using the Ochiai measure of semanticdissimilarity.load ochiaibpm% First get out the data for topics 8 and 11.% Find the indices where they are not equal to 8 or 11.indlab = find(classlab ~= 8 & classlab ~= 11);% Now get rid of these from the distance matrix.ochiaibpm(indlab,:) = [];ochiaibpm(:,indlab)=[];
80 <strong>Exploratory</strong> <strong>Data</strong> <strong>Analysis</strong> <strong>with</strong> <strong>MATLAB</strong>classlab(indlab) = [];% We only need the upper part.n = length(classlab);dissim = [];for i = 1:ndissim = [dissim, ochiaibpm(i,(i+1):n)];end% Find configuration for R^2.d = 2;r = 1;% The nmds function is in the EDA Toolbox.[Xd,stress,dhats] = nmmds(dissim,d,r);ind8 = find(classlab == 8);ind11 = find(classlab == 11);% Plot <strong>with</strong> symbols mapped to class (topic).plot(Xd(ind8,1),Xd(ind8,2),'.',...Xd(ind11,1),Xd(ind11,2),'o')legend({'Class 8';'Class 11'})The resulting plot is shown in Figure 3.4. We see that there is no clearseparation between the two topics, but we do have some interesting structurein this scatterplot indicating the possible presence of sub-topics.❑21.5Topic 8Topic 1110.50−0.5−1−1.5−2−2 −1.5 −1 −0.5 0 0.5 1 1.5 2FIGURE 3.4This shows the results of applying Kruskal’s nonmetric MDS to topics 8 and 11, both ofwhich concern North Korea. We see some interesting structure in this configuration and thepossible presence of sub-topics.
Dimensionality Reduction - Nonlinear Methods 81What should the dimensionality be when we are applying MDS to a set ofdata? This is a rather difficult question to answer for most MDS methods. Inthe spirit of EDA, one could apply the procedure for several values of d andrecord the value for stress. We could then construct a plot similar to the screeplot in PCA, where we have the dimension d on the horizontal axis and thestress on the vertical axis. Stress always decreases <strong>with</strong> the addition of moredimensions, so we would be looking for the point at which the payoff fromadding more dimensions decreases (i.e., the value of d where we see an elbowin the curve).The Statistics Toolbox, Version 5 includes a new function for multidimensionalscaling called mdscale. It does both metric and nonmetricMDS, and it includes several choices for the stress. With this function, one canuse weights, specify the type of starting configuration, and request replicatesfor different random initial configurations.3.2 Manifold LearningSome recently developed approaches tackle the problem of nonlineardimensionality reduction by assuming that the data lie on a submanifold ofEuclidean space M. The common goal of these methods is to producecoordinates in a lower dimensional space, such that the neighborhoodstructure of the submanifold is preserved. In other words, points that areneighbors along the submanifold are also neighbors in the reducedparameterization of the data. (See Figure 3.5 and Example 3.5 for anillustration of these concepts.)These new methods are discussed in this section. We will first presentlocally linear embedding, which is an unsupervised learning algorithm thatexploits the local symmetries of linear reconstructions. Next, we coverisometric feature mapping, which is an extension to classical MDS. Finally,we present a new method called Hessian eigenmaps, which addresses one ofthe limitations of isometric feature mapping.All of these methods are implemented in <strong>MATLAB</strong>, and the code is freelyavailable for download. (We provide the URLs in Appendix B.) Because ofthis, we will not be including all of the code, but will only show how to usethe existing implementations of the techniques.3.2.1 Locally Linear EmbeddingLocally linear embedding (LLE) was developed by Roweis and Saul [2000].The method is an eigenvector-based method, and its optimizations do notinvolve local minima or iterative algorithms. The technique is based onsimple geometric concepts. First, we assume that the data are sampled in
82 <strong>Exploratory</strong> <strong>Data</strong> <strong>Analysis</strong> <strong>with</strong> <strong>MATLAB</strong>151050−5−10−153020100−10−5051015FIGURE 3.5This shows the submanifold for the Swiss roll data set. We see that this is really a 2-Dmanifold (or surface) embedded in a 3-D space.sufficient quantity from a smooth submanifold. We also assume that eachdata point and its neighbors lie on or close to a locally linear patch of themanifold M.The LLE algorithm starts by characterizing the local geometry of thepatches by finding linear coefficients that reconstruct each data point byusing only its k nearest neighbors, <strong>with</strong> respect to Euclidean distance. Therewill be errors in the reconstruction, and these are measured by∑ε ( W) = x i – W ij x ji, (3.4)where the subscript j ranges over those points that are in the neighborhoodof x i . The weights are found by optimizing Equation 3.4 subject to thefollowing constraint:∑j2∑W ij= 1 .jThe optimal weights are found using least squares, the details of which areomitted here.Once the weights W ij are found, we fix these and find a representation y i ofthe original points in a low-dimensional space. This is also done byoptimizing a cost function, which in this case is given by
Dimensionality Reduction - Nonlinear Methods 83∑Φ( y) = y i – W ij y ji. (3.5)This defines a quadratic form in y i , and it can be minimized by solving asparse eigenvector problem. The d eigenvectors corresponding to thesmallest nonzero eigenvalues provide a set of orthogonal coordinatescentered at the origin. The method is summarized below.∑j2Linear EmbeddingLocally1. Determine a value for k and d.2. For each data point x i , find the k nearest neighbors.3. Compute the weights W ij that optimally reconstruct each data pointx i from its neighbors (Equation 3.4).4. Find the d-dimensional points y i that are optimally reconstructedusing the same weights found in step 3 (Equation 3.5).Note that the algorithm requires a value for k, which governs the size of theneighborhood, and a value for d. Of course, different results can be obtainedwhen we vary these values. We illustrate the use of LLE in Example 3.5.Isometric Mapping ISOMAPFeature 3.2.2 -Isometric feature mapping (ISOMAP) was developed by Tenenbaum, deSilva and Langford [2000] as a way of enhancing classical MDS. The basicidea is to use distances along a geodesic path (presumably measured alongthe manifold M) as measures of dissimilarity. As <strong>with</strong> LLE, ISOMAP assumesthat the data lie on an unknown submanifold M that is embedded in a p-dimensional space. It seeks a mapping f: X →Ythat preserves the intrinsicmetric structure of the observations. That is, the mapping preserves thedistances between observations, where the distance is measured along thegeodesic path of M. It also assumes that the manifold M is globally isometricto a convex subset of a low-dimensional Euclidean space.In Figure 3.6, we show an example that illustrates this idea. The Euclideandistance between two points on the manifold is shown by the straight lineconnecting them. If our goal is to recover the manifold, then a truer indicationof the distance between these two points is given by their distance on themanifold, i.e., the geodesic distance along the manifold between the points.The ISOMAP algorithm has three main steps. The first step is to find theneighboring points based on the interpoint distances d ij . This can be done byeither specifying a value of k to define the number of nearest neighbors or aradius ε. The distances are typically taken to be Euclidean, but they can beany valid metric. The neighborhood relations are then represented as a
84 <strong>Exploratory</strong> <strong>Data</strong> <strong>Analysis</strong> <strong>with</strong> <strong>MATLAB</strong>151050−5−10−154020−10 0−5 0 5 10 15FIGURE 3.6This is a data set that was randomly generated according to the Swiss roll parametrization[Tenenbaum, de Silva and Langford, 2000]. The Euclidean distance between two pointsindicated by the circles is given by the straight line shown here. If we are seeking theneighborhood structure as given by the submanifold M, then it would be better to use thegeodesic distance (the distance along the manifold or the roll) between the points. One canthink of this as the distance a bug would travel if it took the shortest path between thesetwo points, while walking on the manifold.weighted graph, where the edges of the graph are given weights equal to thedistance d ij . The second step of ISOMAP provides estimates of the geodesicdistances between all pairs of points i and j by computing their shortest pathdistance using the graph obtained in step one. In the third step, classical MDSis applied to the geodesic distances and an embedding is found in d-dimensional space as described in the first section of this chapter.- ISOMAPProcedure1. Construct the neighborhood graph over all observations by connectingthe ij-th point if point i is one of the k nearest neighbors ofj (or if the distance between them is less than ε). Set the lengths ofthe edges equal to d ij .2. Calculate the shortest paths between points in the graph.3. Obtain the d-dimensional embedding by applying classical MDS tothe geodesic paths found in step 2.
Dimensionality Reduction - Nonlinear Methods 85The input to this algorithm is a value for k or ε and the interpoint distancematrix. It should be noted that different results are obtained when the valuefor k (or ε) is varied. In fact, it could be the case that ISOMAP will return fewerthan n lower-dimensional points. If this happens, then the value of k (or ε)should be increased.Hessian 3.2.3 EigenmapsWe stated in the description of ISOMAP that the manifold M is assumed tobe convex. Donoho and Grimes [2003] developed a method called Hessianeigenmaps that will recover a low-dimensional parametrization for datalying on a manifold that is locally isometric to an open, connected subset ofEuclidean space. This significantly expands the class of data sets wheremanifold learning can be accomplished using isometry principles. Thismethod can be viewed as a modification of the LLE method. Thus, it is alsocalled Hessian locally linear embedding (HLLE).We start <strong>with</strong> a parameter space Θ⊂ R dand a smooth mapping ψ: Θ→R p,where R p is the embedding space and d < p. Further, we assume that Θ is anopen, connected subset of R d , and ψ is a locally isometric embedding of Θinto . The manifold can be written as a function of the parameter space, asfollowsR p M ψΘ=( ).One can think of the manifold as the enumeration m = ψθ ( ) of all possiblemeasurements as one varies the parameters θ for a given process.We assume that we have some observations m i that representmeasurements over many different choices of control parameters θ i (i =1,...,n). These measurements are the same as our observations x i . 6 The HLLEdescription given in Donoho and Grimes [2003] considers the case where alldata points lie exactly on the manifold M. The goal is to recover theunderlying parameterization ψ and the parameter settings θ i , up to a rigidmotion.We now describe the main steps of the HLLE algorithm. We leave out thederivation and proofs because we just want to provide the general ideasunderlying the algorithm. The reader is referred to the original paper and the<strong>MATLAB</strong> code for more information and implementation details.The two main assumptions of the HLLE algorithm are:1. In a small enough neighborhood of each point m, geodesic distancesto nearby points m’ (both on the manifold M) are identical toEuclidean distances between associated parameter points θ and θ’.6We use different notation here to be consistent <strong>with</strong> the original paper.
86 <strong>Exploratory</strong> <strong>Data</strong> <strong>Analysis</strong> <strong>with</strong> <strong>MATLAB</strong>This is called local isometry. (ISOMAP deals <strong>with</strong> the case whereM assumes a globally isometric parameterization.)2. The parameter space Θ is an open, connected subset of , whichis a weaker condition than the convexity assumption of ISOMAP.In general, the idea behind HLLE is to define a neighborhood around somem in M and obtain local tangent coordinates. These local coordinates are usedto define the Hessian of a smooth function f: M →R.The function f isdifferentiated in the tangent coordinate system to produce the tangentHessian. A quadratic form (f) is obtained using the tangent Hessian, and theisometric coordinates θ can be recovered by identifying a suitable basis forthe null space of (f).The inputs required for the algorithm are a set of n p-dimensional datapoints, a value for d, and the number of nearest neighbors k to determine theneighborhood. The only constraint on these values is that min(k,p) > d. Thealgorithm estimates the tangent coordinates by using the SVD on theneighborhood of each point, and it uses the empirical version of the operator(f). The output of HLLE is a set of n d-dimensional embedding coordinates.Example 3.5We generated some data from an S-curve manifold to be used <strong>with</strong> LLE andISOMAP and saved it in a file called scurve.mat. 7 We show both the truemanifold and the data randomly generated from this manifold in Figure 3.7.load scurve% The scurve file contains our data matrix X.% First set up some parameters for LLE.K = 12;d = 2;% Run LLE - note that LLE takes the input data% as rows corresponding to dimensions and% columns corresponding to observations. This is% the transpose of our usual data matrix.Y = lle(X,K,d);% Plot results in scatter plot.scatter(Y(1,:),Y(2,:),12,[angle angle],'+','filled');We show the results in Figure 3.8. Note by the colors that neighboring pointson the manifold are mapped into neighboring points in the 2-D embedding.Now we use ISOMAP on the same data.% Now run the ISOMAP - we need the distances for input.% We need the data matrix as n x p.X = X';dists = squareform(pdist(X));7Look at the file called example35.m for more details on how to generate the data.R d
Dimensionality Reduction - Nonlinear Methods 8732.521.510.50−0.5−1−1−0.500.51 024632.521.510.50−0.5−1−1−0.500.51 0246FIGURE 3.7The top panel shows the true S-curve manifold, which is a 2-D manifold embedded in 3-D.The bottom panel is the data set randomly generated from the manifold. The gray scalevalues are an indication of the neighborhood. See the associated color figure followingpage 144.
88 <strong>Exploratory</strong> <strong>Data</strong> <strong>Analysis</strong> <strong>with</strong> <strong>MATLAB</strong>21.510.50−0.5−1−1.5−2−2.5 −2 −1.5 −1 −0.5 0 0.5 1 1.5 2 2.5FIGURE 3.8This is the embedding recovered from LLE. Note that the neighborhood structure is preserved.See the associated color figure following page 144.options.dims = 1:10; % These are for ISOMAP.options.display = 0;[Yiso, Riso, Eiso] = isomap(dists, 'k', 7, options);Constructing a scatter plot of this embedding to compare <strong>with</strong> LLE is left asan exercise to the reader. As stated in the text, LLE and ISOMAP have someproblems <strong>with</strong> data sets that are not convex. We show an example here usingboth ISOMAP and HLLE to discover such an embedding. These data weregenerated according to the code provided by Donoho and Grimes [2003].Essentially, we have the Swiss roll manifold <strong>with</strong> observations removed thatfall <strong>with</strong>in a rectangular area along the surface.% Now run the example from Grimes and Donoho.load swissrolloptions.dims = 1:10;options.display = 0;dists = squareform(pdist(X'));[Yiso, Riso, Eiso] = isomap(dists, 'k', 7, options);% Now for the Hessian LLE.Y2 = hlle(X,K,d);scatter(Y2(1,:),Y2(2,:),12,tt,'+');
Dimensionality Reduction - Nonlinear Methods 8920151050−5−10−15−20−60 −50 −40 −30 −20 −10 0 10 20 30 400.080.060.040.020−0.02−0.04−0.06−0.08 −0.06 −0.04 −0.02 0 0.02 0.04 0.06 0.08FIGURE 3.9The top panel contains the 2-D coordinates from ISOMAP. We do see the hole in theembedding, but it looks like an oval rather than a rectangle. The bottom panel shows the2-D coordinates from HLLE. HLLE was able to recover the correct embedding. See theassociated color figure following page 144.
90 <strong>Exploratory</strong> <strong>Data</strong> <strong>Analysis</strong> <strong>with</strong> <strong>MATLAB</strong>We see in Figure 3.9 that ISOMAP was unable to recover the correctembedding. We did find the hole, but it is distorted. HLLE was able to findthe correct embedding <strong>with</strong> no distortion.❑We note a few algorithmic complexity issues. The two locally linearembedding methods, LLE and HLLE, can be used on problems <strong>with</strong> manydata points (large n), because the initial computations are performed on smallneighborhoods and they can exploit sparse matrix techniques. On the otherhand, ISOMAP requires the calculation of a full matrix of geodesic distancesfor its initial step. However, LLE and HLLE are affected by thedimensionality p, because they must estimate a local tangent space at eachdata point. Also, in the HLLE algorithm, we must estimate secondderivatives, which can be difficult <strong>with</strong> high-dimensional data.3.3 Artificial Neural Network ApproachesWe now discuss two other methods that we categorize as ones based onartificial neural network (ANN) ideas: the self-organizing map and thegenerative topographic mapping. These ANN approaches also look forintrinsically low-dimensional structures that are embedded nonlinearly in ahigh-dimensional space. As in MDS and the manifold learning approaches,these seek a single global low-dimensional nonlinear model of theobservations. Both of these algorithms try to fit a grid or predefined topology(usually 2-D) to the data, using greedy algorithms that first fit the large-scalelinear structure of the data and then make small-scale nonlinear refinements.There are <strong>MATLAB</strong> toolboxes available for both self-organizing maps andgenerative topographic maps. They are free, and they come <strong>with</strong> extensivedocumentation and examples. Because the code for these methods can bevery extensive and would not add to the understanding of the reader, we willnot be showing the code in the book. Instead, we will show how to use someof the functions in the examples.3.3.1 Self-Organizing Maps - SOMThe self-organizing map or SOM is a tool for the exploration andvisualization of high-dimensional data [Kohonen, 1998]. It derives an orderlymapping of data onto a regular, low-dimensional grid. The dimensionality ofthe grid is usually d = 2 for ease of visualization. It converts complex,nonlinear relationships in the high-dimensional space into simpler geometricrelationships such that the important topological and metric relationships areconveyed. The data are organized on the grid in such a way that observationsthat are close together in the high-dimensional space are also closer to each
Dimensionality Reduction - Nonlinear Methods 91other on the grid. Thus, this is very similar to the ideas of MDS, except thatthe positions in the low-dimensional space are restricted to the grid. The gridlocations are denoted by r i .There are two methods used in SOM: incremental learning and batchmapping. We will describe both of them, and then illustrate some of thefunctions in the SOM Toolbox 8 in Example 3.6. We will also present a briefdiscussion of the various methods for visualizing and exploring the results ofSOM.The incremental or sequential learning method for SOM is an iterativeprocess. We start <strong>with</strong> the set of observations x i and a set of p-dimensionalmodel vectors m i . These model vectors are also called neurons, prototypes, orcodebooks. Each model vector is associated <strong>with</strong> a vertex (r i ) on a 2-D latticethat can be either hexagonal or rectangular and starts out <strong>with</strong> some initialvalue (m i (t=0)). This could be done by setting them to random values, bysetting them equal to a random subset of the original data points or by usingPCA to provide an initial ordering.At each training step, a vector x i is selected and the distance between it andall the model vectors is calculated, where the distance is typically Euclidean.The SOM Toolbox handles missing values by excluding them from thecalculation, and variable weights can also be used. The best-matching unit(BMU) or model vector is found and is denoted by m c . Once the closest modelvector m c is found, the model vectors are updated so that m c is moved closerto the data vector x i . The neighbors of the BMU m c are also updated, in aweighted fashion. The update rule for the model vector m i ism i ( t + 1) = m i () t + αt ()h ci ()x t [ () t – m i () t ],where t denotes time or iteration number. The learning rate is given by α (t)and 0 < α (t) < 1, which decreases monotonically as the iteration proceeds.The neighborhood is governed by the function h ci (t), and a Gaussiancentered at the best-matching unit is often used. The SOM Toolbox has otherneighborhood functions available, as well as different learning rates α (t). Ifthe Gaussian is used, then we haveh ci() tr i – r c= exp – -------------------- ,⎝⎛ 2σ 2() t ⎠⎞where the symbol • denotes the distance, and the r i are the coordinates onthe grid. The size or width of the neighborhood is governed by σ (t), and thisvalue decreases monotonically.The training is usually done in two phases. The first phase corresponds toa large learning rate and neighborhood radius σ (t), which provides a largescaleapproximation to the data. The map is fine tuned in the second phase,28See Appendix B for the website where one can download the SOM Toolbox.
92 <strong>Exploratory</strong> <strong>Data</strong> <strong>Analysis</strong> <strong>with</strong> <strong>MATLAB</strong>where the learning rate and neighborhood radius are small. Once the processfinishes, we have the set of prototype or model vectors over the 2-Dcoordinates on the map grid.The batch training method or Batch Map is also iterative, but it uses thewhole data set before adjustments are made rather than a single vector. Ateach step of the algorithm, the data set is partitioned such that eachobservation is associated <strong>with</strong> its nearest model vector. The updated modelvectors are found as a weighted average of the data, where the weight of eachobservation is the value of the neighborhood function h ic (t) at its BMU c.Several methods exist for visualizing the resulting map and prototypevectors. These methods can have any of the following goals. The first is to getan idea of the overall shape of the data and whether clusters are present. Thesecond goal is to analyze the prototype vectors for characteristics of theclusters and correlations among components or variables. The third task is tosee how new observations fit <strong>with</strong> the map or to discover anomalies. We willfocus on one visualization method called the U-matrix that is often used tolocate clusters in the data [Ultsch and Siemon, 1990].The U-matrix is based on distances. First, the distance of each model vectorto each of its immediate neighbors is calculated. This distance is thenvisualized using a color scale. Clusters are seen as those map units that havesmaller distances, surrounded by borders indicating larger distances.Another approach is to use the size of the symbol to represent the averagedistance to its neighbors, so cluster borders would be shown as largersymbols. We illustrate the SOM and the U-matrix visualization method inExample 3.6.Example 3.6We turn to the oronsay data set to illustrate some of the basic commands inthe SOM Toolbox. First we have to load the data and put it into a <strong>MATLAB</strong>data structure that is recognized by the functions. This toolbox comes <strong>with</strong>several normalization methods, and it is recommended that they be usedbefore building a map.% Use the oronsay data set.load oronsay% Convert labels to cell array of strings.for i = 1:length(beachdune)mid{i} = int2str(midden(i));% Use next one in exercises.bd{i} = int2str(beachdune(i));end% Normalize each variable to have unit variance.D = som_normalize(oronsay,'var');% Convert to a data structure.sD = som_data_struct(D);% Add the labels - must be transposed.
Dimensionality Reduction - Nonlinear Methods 93sD = som_set(sD,'labels',mid');We can visualize the results in many ways, most of which will be left as anexercise. We show the U-matrix in Figure 3.10 and include labels for thecodebook vectors.% Make the SOMsM = som_make(sD);sM = som_autolabel(sM,sD,'vote');% Plot U matrix.som_show(sM,'umat','all');% Add labels to an existing plot.som_show_add('label',sM,'subplot',1);Note that the larger values indicate cluster borders, and low values indicateclusters. By looking at the colors, we see a couple of clusters - one in the lowerleft corner and one in the top. The labels indicate some separation intogroups.❑U−matrix3.8111111111111111011110001110000000001111.960000012000220002200000.123SOM 26−Jun−2004FIGURE 3.10This is the SOM for the oronsay data set. We can see some cluster structure here by thecolors. One is in the upper part of the map, and the other is in the lower left corner. Thelabels on the map elements also indicate some clustering. Recall that the classes are midden(0), Cnoc Coig (1), and Caisteal nan Gillean (2). See the associated color figure followingpage 144.
94 <strong>Exploratory</strong> <strong>Data</strong> <strong>Analysis</strong> <strong>with</strong> <strong>MATLAB</strong>3.3.2 Generative Topographic Maps - GTMThe SOM has several limitations [Bishop, Svensén and Williams, 1996]. First,the SOM is based on heuristics, and the algorithm is not derived from theoptimization of an objective function. Preservation of the neighborhoodstructure is not guaranteed by the SOM method, and there could be problems<strong>with</strong> convergence of the prototype vectors. The SOM does not define adensity model, and the use of the codebook vectors as a model of thedistribution of the original data is limited. Finally, the choice of how theneighborhood function should shrink during training is somewhat of an art,so it is difficult to compare different runs of the SOM procedure on the samedata set. The generative topographic mapping (GTM) was inspired by theSOM and attempts to overcome its limitations.The GTM is described in terms of a latent variable model (or space) <strong>with</strong>dimensionality d [Bishop, Svensén and Williams, 1996, 1998]. The goal is tofind a representation for the distribution p(x) of p-dimensional data, in termsof a smaller number of d latent variables m = (m 1 , ... , m d ). As usual, we wantd < p, and often take d = 2 for ease of visualization. We can achieve this goalby finding a mapping y(m;W), where W is a matrix containing weights, thattakes a point m in the latent space and maps it to a point x in the data space.This might seem somewhat backward from what we considered previously,but we will see later how we can use the inverse of this mapping to viewsummaries of the observations in the reduced latent space.We start <strong>with</strong> a probability distribution p(m) defined on the latent variablespace (<strong>with</strong> d dimensions), which in turn induces a distribution p(y|W) in thedata space (<strong>with</strong> p dimensions). For a given m and W, we choose a Gaussiancentered at y(m;W) as follows:p( xm,W,β)=⎛ β-----⎞ p ⁄ 2 ⎧–βexp ----- ym;W ( ) – x⎝2π⎠⎨⎩22⎫⎬,⎭where the variance is β -1 , 9 and • denotes the inner product. Other modelscan be used, as discussed in Bishop, Svensén and Williams [1998]. The matrixW contains the parameters or weights that govern the mapping. To derive thedesired mapping, we must estimate β and the matrix W.The next step is to assume some form for p(m) defined in the latent space.To make this similar to the SOM, the distribution is taken as a sum of deltafunctions centered on the nodes of a regular grid in latent space:K1p( m)= --- δ( m – m ,K ∑k )k = 19We note that this is different than the usual notation, familiar to statisticians. However, we arekeeping it here to be consistent <strong>with</strong> the original derivation.
Dimensionality Reduction - Nonlinear Methods 95where K is the total number of grid points or delta functions. Each point m kin the latent space is mapped to a corresponding point y(m k ;W) in the dataspace, where it becomes the center of a Gaussian density function. This isillustrated in Figure 3.11.FIGURE 3.11This illustrates the mapping used in GTM. Our latent space is on the left, and the data spaceis on the right. A Gaussian is centered at each of the data points, represented by the spheres.We can use maximum likelihood and the Expectation-Maximization (EM)algorithm (see Chapter 6) to get estimates for β and W. Bishop, Svensén andWilliams [1998] show that the log-likelihood function for the distributiondescribed here is given byL( W,β)=n∑i = 1⎧K⎫⎪---1⎪ln ⎨ p( x . (3.6)K ∑ i m k , W, β)⎬⎪k = 1⎪⎩⎭They next choose a model for y(m;W), which is given byyx;W ( ) = Wφ( x),where the elements of φ (m) have M fixed basis functions φ j (m), and W is ofsize p x M. For basis functions, they choose Gaussians whose centers aredistributed on a uniform grid in latent space. Note that the centers for thesebasis functions are not the same as the grid points m i . Each of these Gaussianbasis functions φ has a common width parameter σ . The smoothness of themanifold is determined by the value of σ, the number of basis functions M,and their spacing.Looking at Equation 3.6, we can view this as a missing-data problem,where we do not know which component k generated each data point x i . The
96 <strong>Exploratory</strong> <strong>Data</strong> <strong>Analysis</strong> <strong>with</strong> <strong>MATLAB</strong>EM algorithm for estimating β and W consists of two steps that are doneiteratively until the value of the log-likelihood function converges. In the E-step, we use the current values of the parameters to evaluate the posteriorprobabilities of each component k for every data point. This is calculatedaccording to the followingτ ki ( W old , β old )=p( x i m k , W old , β old )---------------------------------------------------------- , (3.7)K∑c = 1p( x i m c , W old , β old )where the subscript ‘old’ indicates the current values.In the M-step, we use the posterior probabilities to find weighted updatesfor the parameters. First, we calculate a new version of the weight matrixfrom the following equationΦ T TG old ΦW new=Φ T T old X , (3.8)where Φ is a K x M matrix <strong>with</strong> elements Φ kj = φ j (m k ), X is the data matrix, Tis a K x n matrix <strong>with</strong> elements τ ki , and G is a K x K diagonal matrix wherethe elements are given byn∑G kk = τ ki ( W,β).i = 1Equation 3.8 is solved for W new using standard linear algebra techniques. Atime-saving issue related to this update equation is that Φ is constant, so itonly needs to be evaluated once.We now need to determine an update for β that maximizes the loglikelihood.This is given by1 1-------- = ----- τ . (3.9)np ∑ ∑ kn ( W old , β old ) W old φ( m k – x i ) 2β newnKi = 1 k = 1To summarize, the algorithm requires starting points for the matrix W andthe inverse variance β. We must also specify a set of points m i , as well as a setof basis functions φ j (m). The parameters W and β define a mixture ofGaussians <strong>with</strong> centers Wφ(m k ) and equal covariance matrices given by β -1 I.Given initial values, the EM algorithm is used to estimate these parameters.The E-step finds the posterior probabilities using Equation 3.7, and the M-step updates the estimates for W and β using Equations 3.8 and 3.9. Thesesteps are repeated until the log-likelihood (Equation 3.6) converges.
Dimensionality Reduction - Nonlinear Methods 97So, the GTM gives us a mapping from this latent space to the original p-dimensional data space. For EDA purposes, we are really interested in goingthe other way: mapping our p-dimensional data into some lowerdimensionalspace. As we see from the development of the GTM, each datumx i provides a posterior distribution in our latent space. Thus, this posteriordistribution in latent space provides information about a single observation.Visualizing all observations in this manner would be too difficult, so eachdistribution should be summarized in some way. Two summaries that cometo mind are the mean and the mode, which are then visualized as individualpoints in our latent space. The mean for observation x i is calculated fromm i=K∑k = 1τ ki m k .The mode for the i-th observation (or posterior distribution) is given by themaximum value τ ki over all values of k. The values m i or modes are shown assymbols in a scatterplot or some other visualization scheme.Example 3.7We again turn to the oronsay data to show the basic functionality of theGTM Toolbox. 10 The parameters were set according to the example in theirdocumentation.load oronsay% Initialize parameters for GTM.noLatPts = 400;noBasisFn = 81;sigma = 1.5;% Initialize required variables for GTM.[X,MU,FI,W,beta] = gtm_stp2(oronsay,noLatPts,...noBasisFn,sigma);lambda = 0.001;cycles = 40;[trndW,trndBeta,llhLog] = gtm_trn(oronsay,FI,W,...lambda,cycles,beta,'quiet');The function gtm_stp2 initializes the required variables, and gtm_trn doesthe training. Each observation gets mapped into a probability distribution inthe 2-D map, so we need to find either the mean or mode of each one to showas a point. We can do this as follows:% Get the means in latent space.mus = gtm_pmn(oronsay,X,FI,trndW,trndBeta);% Get the modes in latent space.10See Appendix B for information on where to download the GTM Toolbox.
98 <strong>Exploratory</strong> <strong>Data</strong> <strong>Analysis</strong> <strong>with</strong> <strong>MATLAB</strong>modes = gtm_pmd(oronsay,X,FI,trndW);We now plot the values in the lower-dimensional space using symbolscorresponding to their class.ind0 = find(midden == 0);ind1 = find(midden == 1);ind2 = find(midden == 2);plot(mus(ind0,1),mus(ind0,2),'k.',mus(ind1,1),...mus(ind1,2),'kx',mus(ind2,1),mus(ind2,2),'ko')The resulting plot is shown in Figure 3.12, where we can see some separationinto the three groups.❑10.80.60.40.20−0.2−0.4−0.6−0.8−1−1 −0.8 −0.6 −0.4 −0.2 0 0.2 0.4 0.6 0.8 1FIGURE 3.12This shows the map obtained from GTM, where the distribution for each point is summarizedby the mean. Each mean is displayed using a different symbol: Class 0 is ‘ . ’; Class 1is ‘x’; and Class 2 is ‘o’. We can see some separation into groups from this plot.3.4 Summary and Further ReadingIn this chapter, we discussed several methods for finding a nonlinearmapping from a high-dimensional space to one <strong>with</strong> lower dimensionality.
Dimensionality Reduction - Nonlinear Methods 99The first set of methods was grouped under the name multidimensionalscaling, and we presented both metric and nonmetric MDS. We note that insome cases, depending on how it is set up, MDS finds a linear mapping. Wealso presented several methods for learning manifolds, where the emphasisis on nonlinear manifolds. These techniques are locally linear embedding,ISOMAP, and Hessian locally linear embedding. ISOMAP is really anenhanced version of classical MDS, where geodesic distances are used asinput to classical MDS. HLLE is similar in spirit to LLE, and its mainadvantage is that it can handle data sets that are not convex. Finally, wepresented two artificial neural network approaches called self-organizingmaps and generative topographic maps.We have already mentioned some of the major MDS references, but we alsoinclude them here <strong>with</strong> more information on their content. Our primaryreference for terminology and methods was Cox and Cox [2001]. This is ahighly readable book, suitable for students and practitioners <strong>with</strong> abackground in basic statistics. The methods are clearly stated for bothclassical MDS and nonmetric MDS. Also, the authors provide a CD-ROM<strong>with</strong> programs (running under DOS) and data sets so the reader can use thesetools.Another book by Borg and Groenen [1997] brings many of the algorithmsand techniques of MDS together in a way that can be understood by those<strong>with</strong> a two-semester course in statistics for social sciences or business. Theauthors provide the derivation of the methods, along <strong>with</strong> ways to interpretthe results. They do not provide computer software or show how this can bedone using existing software packages, but their algorithms are very clearand understandable.A brief introduction to MDS can be obtained from Kruskal and Wish [1978].This book is primarily focused on applications in the social sciences, but itwould be useful for those who need to come to a quick understanding of thebasics of MDS. Computational and algorithmic considerations are notstressed in this book. There are many overview papers on MDS in the variousjournals and encyclopedias; these include Mead [1992], Siedlecki, Siedleckaand Sklansky [1988], Steyvers [2002], and Young [1985].Some of the initial work in MDS was done by Shepard in 1962. The firstpaper in the series [Shepard, 1962a] describes a computer program toreconstruct a configuration of points in Euclidean space, when the onlyinformation that is known about the distance between the points is someunknown monotonic function of the distance. The second paper in the series[Shepard, 1962b] presents two applications of this method to artificial data.Kruskal continued the development of MDS by introducing an objectivefunction and developing a method for optimizing it [Kruskal, 1964a, 1964b].We highly recommend reading the original Kruskal papers; they are easilyunderstood and should provide the reader <strong>with</strong> a nice understanding of theorigins of MDS.Because they are relatively recent innovations, there are not a lot ofreferences for the manifold learning methods (ISOMAP, LLE, and HLLE).
100 <strong>Exploratory</strong> <strong>Data</strong> <strong>Analysis</strong> <strong>with</strong> <strong>MATLAB</strong>However, each of the websites has links to technical reports and papers thatdescribe the work in more depth (see Appendix B). A nice overview ofmanifold learning is given in Saul and Roweis [2002], <strong>with</strong> an emphasis onLLE. Further issues <strong>with</strong> ISOMAP are explored in Balasubramanian andSchwartz [2002]. More detailed information regarding HLLE can be found ina technical report written by Donoho and Grimes [2002].There is one book dedicated to SOM written by Kohonen [2001]. Manypapers on SOM have appeared in the literature, and a 1998 technical reportlists 3,043 works that are based on the SOM [Kangas and Kaski, 1998]. A nice,short overview of SOM can be found in Kohonen [1998]. Some recentapplications of SOM have been in the area of document clustering [Kaski, etal., 1998; Kohonen, et al., 2000] and the analysis of gene microarrays [Tamayo,et al., 1999]. Theoretical aspects of the SOM are discussed in Cottrell, Fort andPages [1998]. The use of the SOM for clustering is described in Kiang [2001]and Vesanto and Alhoniemi [2000]. Visualization and EDA methods for SOMare discussed in Mao and Jain [1995], Ultsch and Siemon [1990], Deboeck andKohonen [1998], and Vesanto [1997; 1999]. GTM is a recent addition to thisarea, so there are fewer papers, but for those who want further information,we recommend Bishop, Svensén and Williams [1996, 1997a, 1997b, and 1998],Bishop, Hinton and Strachan [1997], and Bishop and Tipping [1998].Exercises3.1 Try the classical MDS approach using the skull data set. Plot theresults in a scatterplot using the text labels as plotting symbols (see thetext function). Do you see any separation between the categories ofgender? [Cox and Cox, 2001]. Try PCA on the skull data. How doesthis compare <strong>with</strong> the classical MDS results?3.2 Apply the SMACOF and nonmetric MDS methods to the skull dataset. Compare your results <strong>with</strong> the configuration obtained throughclassical MDS.3.3 Use plot3 (similar to plot, but in three dimensions) to construct a 3-D scatterplot of the data in Example 3.1. Describe your results.3.4 Apply the SMACOF method to the oronsay data set and commenton the results.3.5 Repeat the Examples 3.2, 3.4 and problem 3.4 for several values of d.See the help on gplotmatrix and use it to display the results ford > 2. Do a scree-like plot of stress versus d to see what d is best.3.6 The Shepard diagram for nonmetric MDS is a plot where the ordereddissimilarities are on the horizontal axis. The distances (shown aspoints) and the disparities (shown as a line) are on the vertical. Withlarge data sets, this is not too useful. However, <strong>with</strong> small data sets, it
Dimensionality Reduction - Nonlinear Methods 101can be used to see the shape of the regression curve. Implement this in<strong>MATLAB</strong> and test it on one of the smaller data sets.3.7 Try using som_show(sM) in Example 3.6. This shows a U-matrix foreach variable. Look at each one individually and add the labels to theelements: som_show(sM,'comp',1), etc. See the SOM Toolboxdocumentation for more information on how these functions work.3.8 Repeat Example 3.6 and problem 3.7 using the other labels for theoronsay data set. Discuss your results.3.9 Repeat the plot in Example 3.7 (GTM) using the modes instead of themeans. Do you see any difference between them?3.10 Do a help on the Statistics Toolbox (version 5) function mdscale.Apply the methods (metric and nonmetric MDS) to the skulls andoronsay data sets.3.11 Apply the ISOMAP method to the scurve data from Example 3.5.Construct a scatterplot of the data and compare to the results fromLLE.3.12 Apply the LLE method to the swissroll data of Example 3.5.Construct a scatterplot and compare <strong>with</strong> HLLE and ISOMAP.3.13 What is the intrinsic dimensionality of the swissroll and scurvedata sets?3.14 Where possible, apply MDS, ISOMAP, LLE, HLLE, SOM, and GTM tothe following data sets. Discuss and compare the results.a. BPM data setsb. gene expression data setsc. irisd. pollene. possef. oronsayg. skulls3.15 Repeat Example 3.2 <strong>with</strong> different starting values to search fordifferent structures. Analyze your results.