Navigator - Prudential Annuities
Navigator - Prudential Annuities
Navigator - Prudential Annuities

Create successful ePaper yourself
Turn your PDF publications into a flip-book with our unique Google optimized e-Paper software.
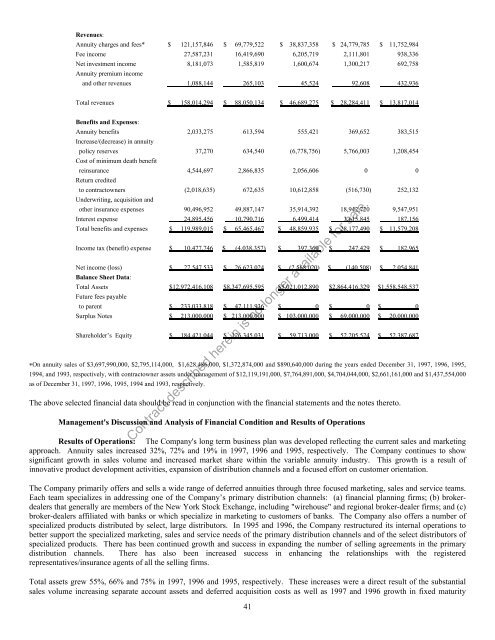
Revenues:Annuity charges and fees* $ 121,157,846 $ 69,779,522 $ 38,837,358 $ 24,779,785 $ 11,752,984Fee income 27,587,231 16,419,690 6,205,719 2,111,801 938,336Net investment income 8,181,073 1,585,819 1,600,674 1,300,217 692,758Annuity premium incomeand other revenues 1,088,144 265,103 45,524 92,608 432,936Total revenues $ 158,014,294 $ 88,050,134 $ 46,689,275 $ 28,284,411 $ 13,817,014Benefits and Expenses:Annuity benefits 2,033,275 613,594 555,421 369,652 383,515Increase/(decrease) in annuitypolicy reserves 37,270 634,540 (6,778,756) 5,766,003 1,208,454Cost of minimum death benefitreinsurance 4,544,697 2,866,835 2,056,606 0 0Return creditedto contractowners (2,018,635) 672,635 10,612,858 (516,730) 252,132Underwriting, acquisition andother insurance expenses 90,496,952 49,887,147 35,914,392 18,942,720 9,547,951Interest expense 24,895,456 10,790,716 6,499,414 3,615,845 187,156Total benefits and expenses $ 119,989,015 $ 65,465,467 $ 48,859,935 $ 28,177,490 $ 11,579,208Income tax (benefit) expense $ 10,477,746 $ (4,038,357) $ 397,360 $ 247,429 $ 182,965Net income (loss) $ 27,547,533 $ 26,623,024 $ (2,568,020) $ (140,508) $ 2,054,841Balance Sheet Data:Total Assets $12,972,416,108 $8,347,695,595 $5,021,012,890 $2,864,416,329 $1,558,548,537Future fees payableto parent $ 233,033,818 $ 47,111,936 $ 0 $ 0 $ 0Surplus Notes $ 213,000,000 $ 213,000,000 $ 103,000,000 $ 69,000,000 $ 20,000,000Shareholder’s Equity $ 184,421,044 $ 126,345,031 $ 59,713,000 $ 52,205,524 $ 52,387,687∗On annuity sales of $3,697,990,000, $2,795,114,000, $1,628,486,000, $1,372,874,000 and $890,640,000 during the years ended December 31, 1997, 1996, 1995,1994, and 1993, respectively, with contractowner assets under management of $12,119,191,000, $7,764,891,000, $4,704,044,000, $2,661,161,000 and $1,437,554,000as of December 31, 1997, 1996, 1995, 1994 and 1993, respectively.The above selected financial data should be read in conjunction with the financial statements and the notes thereto.Management's Discussion and Analysis of Financial Condition and Results of OperationsContract described herein is no longer available for sale.Results of Operations: The Company's long term business plan was developed reflecting the current sales and marketingapproach. Annuity sales increased 32%, 72% and 19% in 1997, 1996 and 1995, respectively. The Company continues to showsignificant growth in sales volume and increased market share within the variable annuity industry. This growth is a result ofinnovative product development activities, expansion of distribution channels and a focused effort on customer orientation.The Company primarily offers and sells a wide range of deferred annuities through three focused marketing, sales and service teams.Each team specializes in addressing one of the Company’s primary distribution channels: (a) financial planning firms; (b) brokerdealersthat generally are members of the New York Stock Exchange, including "wirehouse" and regional broker-dealer firms; and (c)broker-dealers affiliated with banks or which specialize in marketing to customers of banks. The Company also offers a number ofspecialized products distributed by select, large distributors. In 1995 and 1996, the Company restructured its internal operations tobetter support the specialized marketing, sales and service needs of the primary distribution channels and of the select distributors ofspecialized products. There has been continued growth and success in expanding the number of selling agreements in the primarydistribution channels. There has also been increased success in enhancing the relationships with the registeredrepresentatives/insurance agents of all the selling firms.Total assets grew 55%, 66% and 75% in 1997, 1996 and 1995, respectively. These increases were a direct result of the substantialsales volume increasing separate account assets and deferred acquisition costs as well as 1997 and 1996 growth in fixed maturity41