EUSO-IT DFF 400/02/03 - Dipartimento di Fisica e Astronomia
EUSO-IT DFF 400/02/03 - Dipartimento di Fisica e Astronomia
EUSO-IT DFF 400/02/03 - Dipartimento di Fisica e Astronomia

You also want an ePaper? Increase the reach of your titles
YUMPU automatically turns print PDFs into web optimized ePapers that Google loves.
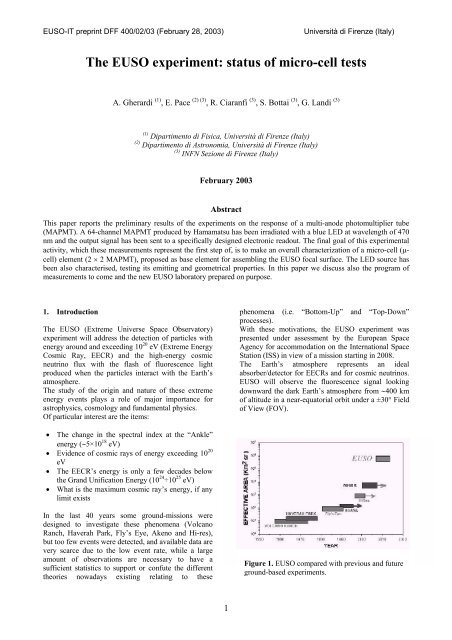
<strong>EUSO</strong>-<strong>IT</strong> preprint <strong>DFF</strong> <strong>400</strong>/<strong>02</strong>/<strong>03</strong> (February 28, 20<strong>03</strong>)Università <strong>di</strong> Firenze (Italy)4. Source characterizationMeasurement using an HPDFig.6 represents the block scheme of the experimentalsetup based on the HPD detector. We pulsed the blueLED using the HP81140 pulse generator; the LEDpulsed signal has duration of 100 ns and amplitude of2.84V. The output signal of HPD is amplified and sentto an ORTEC 673 spectroscopy amplifier with settingsof 3µs shaping time and gain 200. The ADC (CAEN8mm0.5 mmFigure 8. The spot size of the LED as detected by theCMOS sensor.C205) gate has a sampling time of 100 ns that isdelayed to coincide with the amplifier output signalpeak; the ADC integrates the signal acquired in thegate time provi<strong>di</strong>ng a 12-bit <strong>di</strong>gital output signal.The resulting HPD pulse height <strong>di</strong>stribution is shownin Fig. 7 where up to 7 photons can be detected in thepulse time. This spectrum shows that the sourcearrangement allows the required photon-countingregime.LED spotlight characterizationIn order to know the geometrical features of thespotlight at the exit of the fibre optics before thedetector, we used a 1.3 Mpixel CMOS camera(FillFactory Ibis4) having a 17 ×17 µm 2 pixel size.Through this measurement, we can estimate the realsize of the spot at 1.5 cm from the sensor surface. Sincethe full size of the CMOS sensor is 8 × 8 mm 2 , theimage of spot is about 0.5 mm of <strong>di</strong>ameter (see Fig.8),that is less than the MAPMT pixel size. Therefore, wecan expect the spotlight entirely contained in one pixel,so that we can evaluate also the cross-talk level.5. MAPMT experimental setupThe experimental setup is represented in Fig.9, while inFig. 11 we can see the black box with the µcell and thepreamplifier PCB board.The MAPMT’s spectrum is expected with a peaksseparation of 100÷200 channels. In fact, eachpreamplifier’s channel has a <strong>di</strong>fferent gain value(variable from 150 to 250), which optimizes the circuitperformances; the MAPMT gain (at -900V voltagesupply) is ~10 6 . Moreover, the ADC resolution is 900pC into 12 bits, equivalent to 0.22 pC for each channel.BLACK BOXHP81140pulserpulseBlue LEDMAPMTgatesignalPCCAEN C20512 bitsADC32 channelspreamplifierboardFigure 9. MAPMT’s experimental setup.5
<strong>EUSO</strong>-<strong>IT</strong> preprint <strong>DFF</strong> <strong>400</strong>/<strong>02</strong>/<strong>03</strong> (February 28, 20<strong>03</strong>)Università <strong>di</strong> Firenze (Italy)10a10bFigure 10 MAPMT pulse height <strong>di</strong>stribution (on the left) in comparison with Hamamatsu specifications (on the right).To see the real separations in the spectrum, we sent topreamplifier a charge quantity equivalent to one up tofive photons: we measured the calculated peaksseparation.The pulse height <strong>di</strong>stribution of the MAPMT responseto a single photon is obtained by irra<strong>di</strong>ating only onepixel (see Fig.10a) using the source that emits 60-nslight pulses with amplitude of 1.60V (putting a Teflonfilter between the LED and the detector). This<strong>di</strong>stribution is compared with that obtained byHamamatsu (Fig.10b): the curves are similar and thisgives us a good confidence on the correct functioningof apparatus. The <strong>di</strong>stribution obtained with ourdetector presents a better separation between the noisepedestal and the signal: this means that it is easier to<strong>di</strong>scriminate the signal from the noise counts; besides,as we can see, the observed separation peaks is near theexpectated values.• Testing the power supplies• Evaluating saturation permanence of MAPMTs6. Future programThe main aim of Florence INFN group is to realize anew experimental setup to accomplish the scheduledmeasurements program which includes:• Using the UV laser to irra<strong>di</strong>ate the MAPMTpixels• Mo<strong>di</strong>fying the black box, which will contain thepreamplifiers PCB boards to acquire up to 256channels• Implementing rack simulation setup to know theµcell response in realistic con<strong>di</strong>tions (asuperposition of background and fluorescencesignal)• Developing new compact preamplifier PCB board(using a monolithic fast amplifier)• Testing the µ-cell with front-end electronics ([4],[5]).Fig. 11 New <strong>EUSO</strong> laboratory: A) The opticalbench with the instrumentation and the black box.B) Particular of optical bench. C) The black box.D) The MAPMT inside the black box with thenew fiber optic. E) CAMAC crates with theacquisition system.To achieve these goals, we are preparing a newlaboratory (see Fig. 11) with enough room toimplement a bigger setup; Fig. 11 shows also the newoptical bench with the laser and the attenuation systemprovi<strong>di</strong>ng the faint flux required by the photoncounting detector.6
<strong>EUSO</strong>-<strong>IT</strong> preprint <strong>DFF</strong> <strong>400</strong>/<strong>02</strong>/<strong>03</strong> (February 28, 20<strong>03</strong>)Università <strong>di</strong> Firenze (Italy)References1. <strong>EUSO</strong> focal surface subgroup, “Status of <strong>EUSO</strong>focal surface”; <strong>EUSO</strong>-FS-001, June 20<strong>02</strong>.2. <strong>EUSO</strong> proposal, “<strong>EUSO</strong>- Explore the Extremes ofthe Universe using the Highest Energy CosmicRays and Neutrinos”; ESA/MSM-GU/2000.462/AP/RDA, December 2000.3. L. Scarsi, “<strong>EUSO</strong>-An Explorative M issionProbing the Extremes of the Universe using theHighest Energy Cosmic Rays and Neutrinos”;<strong>EUSO</strong> proposal.4. M. Pallavicini “DFEE status report”; INFNGenova, 4th IWG Palermo, 3-5 February 20<strong>03</strong>.5. G. Bosson et al. “AFEE status report”; ISNGrenoble, 4th IWG Palermo, 3-5 February 20<strong>03</strong>.6. “Il programma Airwatch e il progetto <strong>EUSO</strong>”;Luglio 2000; sezioni INFN Firenze, Genova,Catania, Trieste, Torino.37. O. Catalano et al., “<strong>EUSO</strong> – IDD: InstrumentDefinition Document (Phase A Study)”;September 2001.8. M. Pallavicini et al., “Study report on the <strong>EUSO</strong>photo-detector design”.9. O. Catalano et al., Proc. SPIE 3445 478 (1998).10. O. Catalano, Proc. 26th ICRC 2 407 (1999); 2 411(1999).11. S. Giarrusso, et al., Proc. 26th ICRC 5 449 (1999).12. A. Petrolini, P. Musico, S. Cuneo, “Some newsabout the photo-detector development”, INFNGenova, 4th IWG Palermo, 3-5 February 20<strong>03</strong>.AckowledgementsWe wish to thank the Electronic Service of the INFNSection of Florence for its fundamental support and inparticular, weremember D.Lolli, F.Velatini, and M.Ottanelli for theircontribution to the laboratory setup and the dataacquisitionsoftware. We are also grateful to Prof. A. Cartacci andDr. G. Corti for their support.7