130419-03MN107-App G7 Air Monitoring-IA2E.pdf - NIRB
130419-03MN107-App G7 Air Monitoring-IA2E.pdf - NIRB
130419-03MN107-App G7 Air Monitoring-IA2E.pdf - NIRB
You also want an ePaper? Increase the reach of your titles
YUMPU automatically turns print PDFs into web optimized ePapers that Google loves.
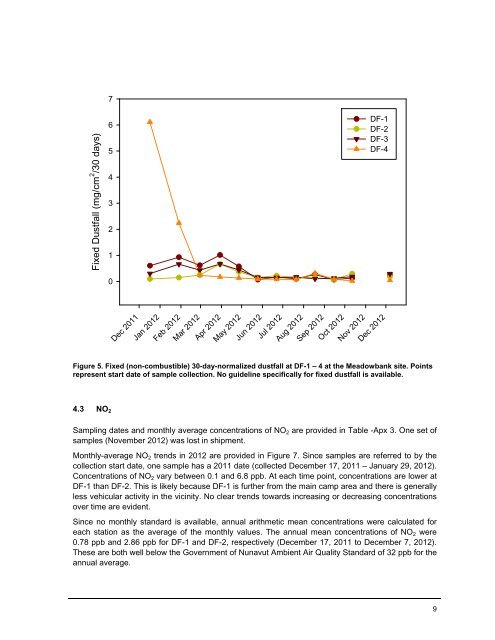
7Fixed Dustfall (mg/cm 2 /30 days)654321DF-1DF-2DF-3DF-40Dec 2011Jan 2012Feb 2012Mar 2012Apr 2012May 2012Jun 2012Jul 2012Aug 2012Sep 2012Oct 2012Nov 2012Dec 2012Figure 5. Fixed (non-combustible) 30-day-normalized dustfall at DF-1 – 4 at the Meadowbank site. Pointsrepresent start date of sample collection. No guideline specifically for fixed dustfall is available.4.3 NO 2Sampling dates and monthly average concentrations of NO 2 are provided in Table -Apx 3. One set ofsamples (November 2012) was lost in shipment.Monthly-average NO 2 trends in 2012 are provided in Figure 7. Since samples are referred to by thecollection start date, one sample has a 2011 date (collected December 17, 2011 – January 29, 2012).Concentrations of NO 2 vary between 0.1 and 6.8 ppb. At each time point, concentrations are lower atDF-1 than DF-2. This is likely because DF-1 is further from the main camp area and there is generallyless vehicular activity in the vicinity. No clear trends towards increasing or decreasing concentrationsover time are evident.Since no monthly standard is available, annual arithmetic mean concentrations were calculated foreach station as the average of the monthly values. The annual mean concentrations of NO 2 were0.78 ppb and 2.86 ppb for DF-1 and DF-2, respectively (December 17, 2011 to December 7, 2012).These are both well below the Government of Nunavut Ambient <strong>Air</strong> Quality Standard of 32 ppb for theannual average.9


