130419-03MN107-App G7 Air Monitoring-IA2E.pdf - NIRB
130419-03MN107-App G7 Air Monitoring-IA2E.pdf - NIRB
130419-03MN107-App G7 Air Monitoring-IA2E.pdf - NIRB

Create successful ePaper yourself
Turn your PDF publications into a flip-book with our unique Google optimized e-Paper software.
Meadowbank Gold Project – 2012 Annual Report<strong>App</strong>endix <strong>G7</strong><strong>Air</strong> Quality and Dustfall <strong>Monitoring</strong> ReportReport: 2012 <strong>Air</strong> Quality and Dustfall <strong>Monitoring</strong> ReportReport: 2012 Preliminary evaluation of dustfall along theMeadowbank AWAR
EXECUTIVE SUMMARYThe 2012 dust and air quality monitoring program at Meadowbank was conducted in support of the<strong>Air</strong> Quality <strong>Monitoring</strong> Plan - Addendum (Golder, 2008). The objective of the 2012 program was tomeasure dustfall, total suspended particulates (TSP), PM10, PM2.5 and NO 2 at four monitoringlocations around the Meadowbank site. Locations were established in 2011 in consultation withEnvironment Canada.Results obtained for the measured parameters were compared to Government of NunavutEnvironmental Standards for Ambient <strong>Air</strong> Quality (October, 2011), where applicable (TSP, PM2.5,NO 2 ).Mass concentrations of suspended particulates (ie TSP, PM10, PM2.5) could not be normalized tostandard temperature and pressure (STP) as required for direct comparison to GN standards.However, the values obtained in this monitoring program are expected to be higher than they wouldbe if calculated for STP. With this assumption, GN standards were not exceeded for the applicablemeasured parameters (TSP, PM2.5, NO 2 ) at any time point or monitoring location in 2012.Dustfall results were compared to the Alberta Environment Department’s recreational area dustfallguideline for context. This guideline was exceeded at least once at all stations prior to May, 2012.However, the guideline was not exceeded at any site beginning in June 2012, which coincided withincreased dust suppression efforts at the mine site.ii
TABLE OF CONTENTSEXECUTIVE SUMMARY ........................................................................................................................ II1 INTRODUCTION ....................................................................................................................... 11.1 Objective .................................................................................................................................... 11.2 <strong>Monitoring</strong> Locations ................................................................................................................. 11.2.1 DF-1 ........................................................................................................................... 11.2.2 DF-2 ........................................................................................................................... 11.2.3 DF-3 ........................................................................................................................... 21.2.4 DF-4 ........................................................................................................................... 22 REGULATORY STANDARDS .................................................................................................. 23 METHODS ................................................................................................................................. 33.1 TSP, PM10, PM2.5 .................................................................................................................... 33.2 Dustfall ....................................................................................................................................... 33.3 NO 2 ............................................................................................................................................ 43.4 Weather Data ............................................................................................................................ 43.5 Greenhouse Gas Emissions ...................................................................................................... 44 RESULTS .................................................................................................................................. 44.1 TSP, PM10, PM2.5 .................................................................................................................... 44.2 Dustfall ....................................................................................................................................... 74.3 NO 2 ............................................................................................................................................ 94.4 Weather Data .......................................................................................................................... 104.5 Greenhouse Gas Emissions .................................................................................................... 105 QA/QC ..................................................................................................................................... 116 SUMMARY .............................................................................................................................. 116.1 Comparison to Regulatory Standards and Guidelines ............................................................ 116.1.1 GN Standards (for TSP, PM2.5, NO 2 ) ..................................................................... 116.1.2 Dustfall Guideline ..................................................................................................... 116.2 Temporal and Spatial Trends .................................................................................................. 117 RECOMMENDATIONS ........................................................................................................... 118 REFERENCES ........................................................................................................................ 25<strong>App</strong>endix A:Data TablesAPPENDICESiii
LIST OF TABLESTable 1. UTM coordinates and dates of measurement for the Meadowbank noise monitoringlocations. *Indicates measurement data not available due to equipment malfunction. ............. 1Table 2. Government of Nunavut Environmental Standards for Ambient <strong>Air</strong> Quality (October,2011) for the parameters of concern at Meadowbank. All values are for standardconditions of 25°C and 101.3 kPa. ............................................................................................ 2LIST OF FIGURESFigure 1. <strong>Air</strong> quality and dustfall monitoring locations at the Meadowbank siteError! Bookmark not defined.Figure 2. 24-average total suspended particulates (TSP) at Meadowbank DF-1 and DF-2,calculated using volumetric flow rate (non-STP-normalized). Dashed line indicates the24-hr average GN standard for ambient air quality, normalized to STP conditions. ............... 5Figure 3. 24-average concentration of airborne particulate matter less than 10 microns (PM10) atMeadowbank DF-1 and DF-2, calculated using volumetric flow rate (non-STPnormalized).There is no GN standard for this parameter. ..................................................... 6Figure 4. 24-average concentration of airborne particulate matter less than 2.5 microns (PM2.5)at Meadowbank DF-1 and DF-2, calculated using volumetric flow rate (non-STPnormalized).Dashed line indicates the 24-hr average GN standard for ambient airquality, normalized to STP conditions. .................................................................................... 7Figure 5. Total 30-day-normalized dustfall at DF-1 – 4 at the Meadowbank site. Points representstart date of sample collection. Dashed line indicates the Alberta EnvironmentDepartment’s recreational area guideline of 0.53 mg/cm 2 /30d. .............................................. 8Figure 6. Fixed (non-combustible) 30-day-normalized dustfall at DF-1 – 4 at the Meadowbanksite. Points represent start date of sample collection. No guideline specifically for fixeddustfall is available. ................................................................................................................. 9Figure 7. Monthly average concentration of NO 2 at DF-1 and DF-2. Points represent start date ofsample collection. Dashed line indicates GN standard for the annual average. .................. 10iv
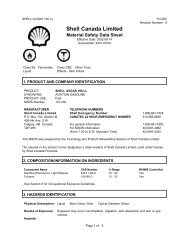
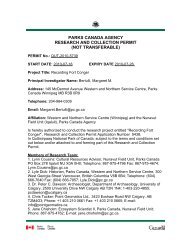
1 INTRODUCTION1.1 OBJECTIVESince November, 2011, Agnico-Eagle Mines Ltd. (AEM) has conducted outdoor dust and air qualitymonitoring at their Meadowbank site, near Baker Lake, Nunavut, as required by <strong>NIRB</strong> ProjectCertificate No. 004.The objective of this program is to monitor ambient air quality around the mine site perimeter, with thegoal of mitigating potential environmental effects. The parameters measured in 2012, in accordancewith the Project Certificate, were suspended particulates (total, PM10, PM2.5), NO 2 and dustfall(settleable particulate matter). As described in the <strong>Air</strong> Quality <strong>Monitoring</strong> Plan - Addendum (Golder,2008), dustfall was measured approximately monthly and normalized to 30 days; suspendedparticulates were measured over 24 h on a six day cycle; and NO 2 was measured over approximatelyone month periods.1.2 MONITORING LOCATIONS<strong>Monitoring</strong> locations were determined in consultation with Environment Canada in 2011. One stationwas moved in 2012 due to changes in the location of the Vault haul road (see Section 1.2.4). UTMcoordinates are provided in Table 1, and locations are shown in relation to minesite features in Figure1. Note that only the final position of DF-4 is shown on the figure, but coordinates for both locationsare provided.Table 1. UTM coordinates and dates of measurement for the Meadowbank air quality and dustfallmonitoring locations.<strong>Monitoring</strong>LocationMeasured Parameters Easting NorthingDF-1 TSP, PM10, PM2.5, NO 2 , dustfall 636850 7217663DF-2 TSP, PM10, PM2.5, NO 2 , dustfall 637895 7213049DF-3 Dustfall 639599 7213198DF-4 (Jan-Feb) Dustfall 639560 7216715DF-4 (Mar-Dec) Dustfall 639233 72170741.2.1 DF-1Station DF-1 is located next to the explosive storage area (emulsion plant), and approximately 500 mnorth of the all-weather access road. TSP, PM10, PM2.5, NO 2 and dustfall were monitored at thislocation from April through October 2012, when the unit was removed for calibration.1.2.2 DF-2Station DF-2 is located at the northern corner of South Camp Island, near the TCG contractor area.TSP, PM10, PM2.5, NO 2 and dustfall were monitored at this location from April through December2012.1
Turn LakePhaser Lake Vault LakeWally LakeLegend!(<strong>Air</strong> Quality & Dust<strong>Monitoring</strong> LocationQuarryAWAR QuarryDikes!(DF-1Portage Attenuation FacilityTailings Storage FacilityRoads!(DF-4AWARStockpilesDrilltrail LakeFacility<strong>Air</strong>stripNP2Portage Rock Storage FacilityDogleg North! ! ! ! ! !! !!!!!!!! !!! ! !!!!! ! !!! !! ! ! !!!!!! !!! ! !! !!!Mine Pit AreaPit CapDogleg PondNorthBasinSecond Portage LakeThird Portage Lake!(DF-2!(DF-3<strong>Air</strong> Quality & Dust<strong>Monitoring</strong> LocationsBayGooseBasin0 0.5 1 2KilometresEastBasinPROJECT: DA11-062-03CLIENT: Agnico-Eagle Mines Ltd., Meadowbank Div.²DATE: MARCH 2013SCALE: 1:35,000DRAWN BY: LCCHECKED BY:UTM Zone 14 NAD83FIGURE:1The information displayed on this map has been compiled from varioussources. While every effort has been made to accurately depict theinformation, this map should not be relied on as being a preciseindicator of locations, features, or roads, nor as a guide to navigation.MNR data provided by Queen's Printer of Ontario. Use of the data in anyderivative product does not constitute an endorsement by the MNR orthe Ontario Government of such products.
1.2.3 DF-3Station DF-3 is approximately 1,800 m east of the East Dike. Second Portage Lake is to the west andeast. Dustfall only was monitored at this location from January through December 2012.1.2.4 DF-4Station DF-4 is approximately 1,500 m southwest of the future location of Vault Pit. This monitoringstation was installed before the beginning of the construction of the Vault Road. Realignment of theroad during construction placed the station within 10 feet of the road. Therefore, AEM re-positionedStation DF-4 approximately 480 m to the north-west on February 29, 2012 to be representative of theoriginally intended location relative to the road.Dustfall only was monitored at this location from January through December 2012.2 REGULATORY STANDARDSData collected from the air quality and dustfall monitoring program at Meadowbank were compared tothe available Government of Nunavut Environmental Standards for Ambient <strong>Air</strong> Quality (October,2011). Standards for the measured parameters are provided in Table 2.Table 2. Government of Nunavut Environmental Standards for Ambient <strong>Air</strong> Quality (October, 2011) for theparameters of concern at Meadowbank. All values are for data normalized to standard conditions of 25°Cand 101.3 kPa.ParameterTime FrameStandardµg/m 3Fine Particulate Matter (PM2.5) 24-h average 30Total Suspended Particulate (TSP) 24-h average 120Annual geometric mean 60ppbNitrogen Dioxide (NO 2 ) 1-h average 400 21324-h average 200 106Annual arithmetic mean 60 32No standard is yet available for coarse particulate matter (PM10).Likewise, no standards for dustfall are available for Nunavut. Results of the dustfall analysis werecompared to the Alberta Environment Department recreational area guideline of 0.53mg/cm 2 /30d, toprovide context.For all parameters and locations, trends over time were assessed.2
3 METHODS3.1 TSP, PM10, PM2.5In 2012, AEM field staff sampled suspended particulates (TSP, PM10, PM2.5) at two locations over24 h every six days, using a Partisol Plus Model 2025 Sequential <strong>Air</strong> Sampler. Partisol samplers drawin a stream of ambient air at a controlled flow rate through a size-selective inlet and a pre-weighedfilter. The exposed filter is then shipped to the laboratory and re-weighed to measure the totalaccumulated particulates. For comparison to Government of Nunavut Ambient <strong>Air</strong> Quality Standards(2011), concentrations of particulates must be calculated asC = M/V STDWhere: C = mass concentration of particulates (µg/m 3 )M = final mass of filter – initial mass of filter (µg)V STD = volume of air drawn in during the sampling period, normalized to 25°C and 101.3kPA(standard temperature and pressure; STP)The Partisol instrument can calculate and store the V STD value for each filter, but the default is torecord the volumetric flow rate (non-STP-normalized), as per the US EPA method. Since the defaultsettings were not adjusted in 2012, mass concentrations of particulates could not be normalized toSTP, per the Canadian method. As a result, mass concentrations of suspended particulates werecalculated using the volumetric flow rate, as in the US EPA method:C = M/(Flow Rate VOL x Time)Where: C = mass concentration of particulates (µg/m 3 )M = final mass of filter – initial mass of filter (µg)Flow Rate VOL = volumetric flow rate16.7 L/min for TSP1.7 L/min for PM1015 L/min for PM2.5The US EPA method is expected to be conservative in this case. Since typical temperatures at theMeadowbank site are well below 25°C, the amount of air sampled per filter would be expected to behigher than the calculated volume, resulting in overestimates of particulate concentrations comparedto STP-normalized values. Furthermore, the air sampling unit is housed in an insulated container,because winter temperatures inhibit operation. Since the unit’s ambient temperature sensor is warmerthan actual air temperature for much of the year, intake volumes would be even more inflated.Although results of particulate sampling will be compared to GN standards, these factors will be takeninto consideration in assessing results.3.2 DUSTFALLDustfall was collected in open vessels containing a purified liquid matrix over one month periods(approximately) at four locations. Particles are deposited and retained in the liquid, which was then3
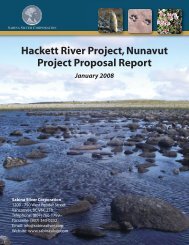
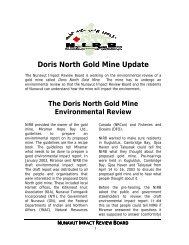
analyzed by an accredited laboratory for total and fixed (non-combustible) dustfall. Calculated dustfallrates were normalized to 30 days (mg/cm 2 /30 days).3.3 NO 2Concentrations of NO 2 by volume (ppb) were analyzed over one month periods (approximately 30days) using a passive sampling device provided by Maxxam Analytics. No continuous monitoring wasproposed for other gaseous pollutants because of low concentrations predicted in pre-constructiondispersion modelling (Cumberland, 2005).The annual average NO 2 concentration by volume was calculated from the monthly data forcomparison against the relevant standard.3.4 WEATHER DATAWeather data for the dustfall and air quality monitoring periods was collected using the mine site’spermanent weather station. Daily averages for wind speed, wind direction and temperature wereavailable from this station.3.5 GREENHOUSE GAS EMISSIONSAEM is required by the Greenhouse Gas Emissions Reporting Program (GHGRP) to trackgreenhouse gas emissions based on annual fuel consumption, composition and the US EPA’s AP-42emission factors.4 RESULTS4.1 TSP, PM10, PM2.5Sampling dates and 24-h average concentrations of TSP, PM10 and PM2.5 calculated usingvolumetric flow rate (non-STP normalized) and are provided in Table -Apx 1.As mentioned previously the 24-h average concentrations of suspended particulates calculated hereare expected to be higher than they would be if normalized to STP (see Section 3.1). Despite this, allmeasured values were below their respective 24-h GN standards, as shown in Figures 2 - 4.The annual geometric mean concentrations of TSP at DF-1 and DF-2 were 8.04 µg/m 3 and 12.04µg/m 3 , respectively. These estimates are well below the annual GN standard of 60 µg/m 3 .Overall, no clear trends over time or between sampling stations were observed. Several higherconcentrations of PM10 were observed near the beginning of the sampling period (April, 2012) at DF-2, but results of this magnitude were not observed again, and these results may have been due to anunidentified sampling error. PM10 values in 2013 will continue to be monitored with specific attentionto this time period, to determine whether this is a recurring trend.4
180160140DF-1DF-2GN StandardTSP (ug/m 3 )120100806040200Apr-2012May-2012Jun-2012Jul-2012Aug-2012Sep-2012Oct-2012Nov-2012Dec-2012Jan-2013Figure 1. 24-average total suspended particulates (TSP) at Meadowbank DF-1 and DF-2, calculated usingvolumetric flow rate (non-STP-normalized). Dashed line indicates the 24-hr average GN standard forambient air quality, normalized to STP conditions.5
20001500DF-1DF-2PM10(ug/m 3 )10005000Apr-2012May-2012Jun-2012Jul-2012Aug-2012Sep-2012Oct-2012Nov-2012Dec-2012Jan-2013Figure 2. 24-average concentration of airborne particulate matter less than 10 microns (PM10) atMeadowbank DF-1 and DF-2, calculated using volumetric flow rate (non-STP-normalized). There is no GNstandard for this parameter.6
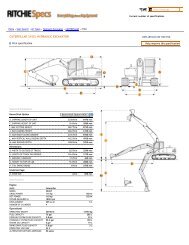
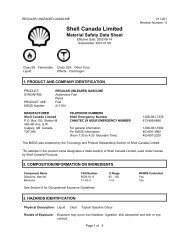
5040DF-1DF-2GN StandardPM2.5 (ug/m 3 )3020100Apr-2012May-2012Jun-2012Jul-2012Aug-2012Sep-2012Oct-2012Nov-2012Dec-2012Jan-2013Figure 3. 24-average concentration of airborne particulate matter less than 2.5 microns (PM2.5) atMeadowbank DF-1 and DF-2, calculated using volumetric flow rate (non-STP-normalized). Dashed lineindicates the 24-hr average GN standard for ambient air quality, normalized to STP conditions.4.2 DUSTFALLSampling dates and 30-day normalized concentrations of dustfall are provided in Table -Apx 2. Oneset of samples (November 2012) was lost in shipment.Results of the 2012 dustfall sampling program (30-day normalized rates of total and fixed dustfall) areprovided in Figure 5 and 6. Since samples are referred to by the collection start date, one sample hasa 2011 date (collected December 17, 2011 – January 29, 2012). Fixed dustfall formed 80-100% oftotal dustfall in 67% of samples. To provide context, the Alberta Environment Department’srecreational area dustfall guideline of 0.53 mg/cm 2 /30 days is indicated.This guideline was exceeded at DF-1 from January – May, 2012, and at DF-2 in March, 2012. Theguideline was slightly exceeded at DF-3 at two time points (February 2012 – 0.661 mg/cm 2 /30 days;May 2012 - 0.669 mg/cm 2 /30 days), and at DF-4 at two time points (December 2011 6.11 mg/cm 2 /30days; January 2012 – 2.24 mg/cm 2 /30 days). Construction of the Vault haul road immediatelyadjacent to DF-4 in December 2011 appears to have caused the high values at this site in December2011 and January 2012. This station was moved approximately 480 m to the north-west on February29, 2012 (see section 1.2.4).7
As recommended in the 2011 <strong>Air</strong> Quality and Dustfall <strong>Monitoring</strong> Report (AEM, 2012), dustsuppression efforts were increased in 2012 in order to reduce dust generation. Beginning in June2012, calcium chloride was applied as a dust suppressant on the roads around the Meadowbank site.Several applications were made throughout the summer of 2012.A light oil based dust suppressant was tested on a portion of the airstrip (a major source of dustonsite). The product was effective and will be applied to the airstrip in the spring of 2013. Water wasalso used daily during summer months as dust suppressant on the airstrip and mine haul roads in2012. During winter (January to May), it’s not possible to apply dust suppressant.Since June 2012, the recreational area guideline has not been exceeded at any station (includingonsite stations, DF-1 and DF-2), at any time point.7Total Dustfall (mg/cm 2 /30 days)654321DF-1DF-2DF-3DF-4Guideline0Dec 2011Jan 2012Feb 2012Mar 2012Apr 2012May 2012Jun 2012Jul 2012Aug 2012Sep 2012Oct 2012Nov 2012Dec 2012Figure 4. Total 30-day-normalized dustfall at DF-1 – 4 at the Meadowbank site. Points represent start dateof sample collection. Dashed line indicates the Alberta Environment Department’s recreational areaguideline of 0.53 mg/cm 2 /30d.8
7Fixed Dustfall (mg/cm 2 /30 days)654321DF-1DF-2DF-3DF-40Dec 2011Jan 2012Feb 2012Mar 2012Apr 2012May 2012Jun 2012Jul 2012Aug 2012Sep 2012Oct 2012Nov 2012Dec 2012Figure 5. Fixed (non-combustible) 30-day-normalized dustfall at DF-1 – 4 at the Meadowbank site. Pointsrepresent start date of sample collection. No guideline specifically for fixed dustfall is available.4.3 NO 2Sampling dates and monthly average concentrations of NO 2 are provided in Table -Apx 3. One set ofsamples (November 2012) was lost in shipment.Monthly-average NO 2 trends in 2012 are provided in Figure 7. Since samples are referred to by thecollection start date, one sample has a 2011 date (collected December 17, 2011 – January 29, 2012).Concentrations of NO 2 vary between 0.1 and 6.8 ppb. At each time point, concentrations are lower atDF-1 than DF-2. This is likely because DF-1 is further from the main camp area and there is generallyless vehicular activity in the vicinity. No clear trends towards increasing or decreasing concentrationsover time are evident.Since no monthly standard is available, annual arithmetic mean concentrations were calculated foreach station as the average of the monthly values. The annual mean concentrations of NO 2 were0.78 ppb and 2.86 ppb for DF-1 and DF-2, respectively (December 17, 2011 to December 7, 2012).These are both well below the Government of Nunavut Ambient <strong>Air</strong> Quality Standard of 32 ppb for theannual average.9
353025DF-1DF-2GN StandardNO 2(ppb)20151050Dec 2011Jan 2012Feb 2012Mar 2012Apr 2012May 2012Jun 2012Jul 2012Aug 2012Sep 2012Oct 2012Nov 2012Dec 2012Figure 6. Monthly average concentration of NO 2 at DF-1 and DF-2. Points represent start date of samplecollection. Dashed line indicates GN standard for the annual average.4.4 WEATHER DATADaily averages for wind speed, wind direction and temperature are provided in Table -Apx 4.4.5 GREENHOUSE GAS EMISSIONSEstimated greenhouse gas emissions for the Meadowbank site in 2012 were 202,201 tonnes CO 2equivalent. This is an increase of 23% from the 2011 emissions of 164, 618 t CO 2 equivalent. Thisincrease is explained by an increase in production of 28%.10
5 QA/QCQA/QC procedures in 2012 included the use of an accredited lab for sample preparation andanalysis, and sample collection by appropriate personnel (trained by a professional air qualityspecialist). This report was prepared by environmental professionals. AEM's Partisol instruments aresent for calibration yearly.Procedures in 2013 will include the use of travel blanks as part of sample submissions.6 SUMMARY6.1 COMPARISON TO REGULATORY STANDARDS AND GUIDELINES6.1.1 GN Standards (for TSP, PM2.5, NO 2 )Although concentrations of suspended particulates were not directly comparable to GN standards, thevalues obtained in this monitoring program are expected to be higher than they would be if calculatedfor standard conditions (see Section 3.1).With the above assumption, GN standards for the measured parameters (TSP, PM2.5, NO 2 ) were notexceeded at any time point or monitoring location in 2012.6.1.2 Dustfall GuidelineResults of the dustfall collection program were compared to the Alberta Environment Department’srecreational area dustfall guideline for reference. This guideline was exceeded from January – May atDF-1, in March at DF-2, in February and May at DF-3, and in December 2011 and January 2012 atDF-4. However, the guideline has not been exceeded at any site since June 2012, when dustsuppression efforts were increased. It is not possible to apply dust suppressant in the winter.6.2 TEMPORAL AND SPATIAL TRENDSOverall, no trends were evident over the year or between sampling stations for suspendedparticulates (TSP, PM10 and PM2.5).Dustfall at all stations decreased in June 2012, likely as a result of an increase in dust suppressionefforts. Aside from the high values observed at DF-4 prior to re-location away from the road, no cleartrends between sites were observed.Concentrations of NO 2 were always lower at DF-1 compared to DF-2, likely because DF-1 is moreremote. No clear trends over the year were observed.7 RECOMMENDATIONSProfessional calibration of the Partisol instruments is recommended on an annual basis.11
The Partisol instrument should be set to record STP-normalized volume such that results canbe directly compared with GN standards.If possible, the temperature sensor of the Partisol instrument should be maintained at theexterior ambient air temperature, so that internal mass flow calculations and the recorded airvolume are accurate.The use of travel blanks should be considered as recommended in the monitoring plan.It is AEM’s intent to implement all recommendations made in this report for the 2013 <strong>Air</strong> <strong>Monitoring</strong>Program.12
8 REFERENCESAEM, 2012. 2011 Dust and <strong>Air</strong> Quality <strong>Monitoring</strong> Report. Meadowbank Gold Project. Prepared forNunavut Impact Review Board.Cumberland Resources Ltd. 2005. Meadowbank Gold Project <strong>Air</strong> Quality Impact Assessment Report.Golder Associates Ltd. (Golder) 2008. Technical Memorandum. Addendum Report: <strong>Air</strong> Quality<strong>Monitoring</strong> Meadowbank Gold Project. Prepared for Agnico-Eagle Mines Ltd. May 16, 2008.25
<strong>App</strong>endix AData Tables
Table -Apx 1. No sample (NS) is available for certain dates due to contamination of filters, filter jams, ordifficulties with instrument set-up. Units at DF-1 were removed from site for calibration on October 27,2012 (Cal.).StartEndTSP (µg/m 3 /30 d) PM10 (µg/m 3 /30 d) PM2.5 (µg/m 3 /30 d)DF-1 DF-2 DF-1 DF-2 DF-1 DF-23/4/2012 4/4/2012 21.58 NS 22.47 1274.51 0.6 NS9/4/2012 10/4/2012 13.1 NS 43.3 239.38 0.6 NS15/4/2012 16/4/2012 6.53 NS 69.44 53.1 1.11 NS21/4/2012 22/4/2012 2.91 NS 26.96 1613.56 0.51 NS27/4/2012 28/4/2012 24.16 NS 60.46 408.09 0.14 NS3/5/2012 4/5/2012 19.84 NS NS 129.9 NS NS9/5/2012 10/5/2012 9.4 NS NS 116.01 NS NS15/5/2012 16/5/2012 16.38 NS NS 99.26 NS NS21/5/2012 22/5/2012 2.95 26.9 17.97 NS 0.88 NS27/5/2012 28/5/2012 20.33 45.74 45.34 100.08 2.04 0.832/6/2012 3/6/2012 2.45 12.81 17.97 8.17 0.28 0.288/6/2012 9/6/2012 2.29 16.8 4.9 42.08 0.37 1.9914/6/2012 15/6/2012 2.74 2.16 9.4 7.76 0.14 0.1920/6/2012 21/6/2012 24.53 31.19 60.46 78.84 1.39 1.6726/6/2012 27/6/2012 0.75 12.77 3.27 41.67 0.14 1.392/7/2012 3/7/2012 19.29 65.29 39.62 225.49 0.74 6.118/7/2012 9/7/2012 17.67 22.21 25.33 45.34 0.28 1.6714/7/2012 15/7/2012 6.94 31.1 8.99 71.08 0.28 4.7220/7/2012 21/7/2012 26.99 13.27 50.65 47.39 3.94 0.8826/7/2012 27/7/2012 1.46 26.99 8.17 62.5 0.14 2.361/8/2012 2/8/2012 1.66 3.12 8.58 17.57 0.14 0.147/8/2012 8/8/2012 8.82 8.57 28.59 20.42 0.6 0.3213/8/2012 14/8/2012 14.22 9.65 29.41 17.16 1.94 0.3219/8/2012 20/8/2012 71.11 11.19 110.29 23.28 2.04 1.2525/8/2012 26/8/2012 10.85 33.81 21.65 248.37 0.74 8.8931/8/2012 1/9/2012 3.74 4.03 NS 15.11 NS 1.026/9/2012 7/9/2012 35.6 6.78 NS 28.59 NS 0.1412/9/2012 13/9/2012 2.7 27.94 3.27 33.91 0.37 1.318/9/2012 19/9/2012 16.26 14.97 24.1 26.55 1.16 1.6724/9/2012 25/9/2012 17.3 8.57 4.9 23.69 0.14 1.1130/9/2012 1/10/2012 1.54 2.66 6.54 13.07 0.19 0.146/10/2012 7/10/2012 3.49 8.57 NS 22.47 NS 1.0212/10/2012 13/10/2012 23.66 38.76 NS 53.51 NS 2.8718/10/2012 19/10/2012 9.27 36.76 NS 121.32 NS 2.0824/10/2012 25/10/2012 4.08 15.55 NS NS NS 0.51
StartEndTSP (µg/m 3 /30 d) PM10 (µg/m 3 /30 d) PM2.5 (µg/m 3 /30 d)DF-1 DF-2 DF-1 DF-2 DF-1 DF-230/10/2012 31/10/2012 Cal. NS Cal. NS Cal. NS11/11/2012 12/11/2012 Cal. NS Cal. NS Cal. NS17/11/2012 18/11/2012 Cal. NS Cal. NS Cal. NS23/11/2012 24/11/2012 Cal. NS Cal. NS Cal. NS29/11/2012 30/11/2012 Cal. NS Cal. 14.71 Cal. NS5/12/2012 6/12/2012 Cal. 4.78 Cal. 13.48 Cal. 0.7411/12/2012 12/12/2012 Cal. 5.41 Cal. 17.16 Cal. 0.5117/12/2012 18/12/2012 Cal. 2.95 Cal. 22.88 Cal. 0.3223/12/2012 24/12/2012 Cal. 2.37 Cal. 17.16 Cal. 0.6929/12/2012 30/12/2012 Cal. NS Cal. NS Cal. NSTable -Apx 2. Total and fixed (non-combustible) dustfall at Meadowbank monitoring stations DF-1-4. *One set of samples was lost in transit and re-sent (results pending).StartEndTotal (mg/cm²/30 days)Fixed (mg/cm²/30 days)DF-1 DF-2 DF-3 DF-4 DF-1 DF-2 DF-3 DF-417/12/2011 29/01/2012 0.625 0.094 0.310 6.260 0.605 0.094 0.301 6.11029/01/2012 29/02/2012 0.929 0.174 0.683 2.339 0.929 0.149 0.661 2.24029/02/2012 30/03/2012 0.647 0.274 0.455 0.257 0.617 0.245 0.433 0.23530/03/2012 27/04/2012 1.047 0.701 0.693 0.197 1.015 0.669 0.669 0.17327/04/2012 25/05/2012 0.590 0.370 0.449 0.134 0.575 0.370 0.441 0.13425/05/2012 22/06/2012 0.110 0.181 0.197 0.314 0.071 0.150 0.157 0.09422/06/2012 21/07/2012 0.205 0.274 0.182 0.129 0.167 0.220 0.144 0.08421/07/2012 18/08/2012 0.157 0.153 0.177 0.094 0.105 0.142 0.165 0.07318/08/2012 15/09/2012 0.307 0.205 0.150 0.346 0.268 0.142 0.102 0.31515/09/2012 12/10/2012 0.136 0.140 0.186 0.153 0.068 0.078 0.124 0.08512/10/2012 10/11/2012 0.162 0.319 0.198 0.030 0.132 0.296 0.182 0.02310/11/2012 07/12/2012 * * * * * * * *07/12/2012 12/01/2013 0.25 0.213 0.309 0.05 0.242 0.198 0.294 0.044
Table -Apx 3. Mean concentration of NO 2 at Meadowbank monitoring stations DF-1 and DF-2. * One set ofsamples lost in transit and re-sent (results pending ). ‡ One sampler had a missing cartridge at time ofcollection.StartEndNO 2 (ppb)DF-1DF-217/12/2011 29/01/2012 1.3 529/01/2012 29/02/2012 0.8 1.329/02/2012 30/03/2012 ‡ 2.230/03/2012 27/04/2012 0.3 1.327/04/2012 25/05/2012 0.9 4.125/05/2012 22/06/2012 0.2 2.322/06/2012 21/07/2012 2.3 6.821/07/2012 18/08/2012 0.1 1.118/08/2012 15/09/2012 1.2 1.915/09/2012 12/10/2012 0.5 1.912/10/2012 10/11/2012 0.2 3.610/11/2012 07/12/2012 * *07/12/2012 12/01/2013 1.4 5.2
Table -Apx 4. Average temperature, wind speed and wind direction for all available dates in 2012 at theMeadowbank site.DateAverage Temperature Wind Speed Wind Direction(°C)(m/s)(deg)16/01/2012 -34.58 4.838 310.417/01/2012 -36.95 6.152 278.418/01/2012 -34.23 3.289 239.719/01/2012 -35.9 5.125 119.620/01/2012 -33.1 5.502 51.9521/01/2012 -33.07 3.351 83.425/01/2012 -24.77 6.485 118.726/01/2012 -21.27 6.162 128.127/01/2012 -21.32 6.105 125.428/01/2012 -21.73 3.534 129.929/01/2012 -33.49 7.99 347.330/01/2012 -34.88 7.247 346.631/01/2012 -30.44 4.024 339.102/02/2012 -27.71 2.234 127.803/02/2012 -25.13 2.948 155.704/02/2012 -17.68 4.167 247.305/02/2012 -14.54 7.54 192.906/02/2012 -25.85 8.1 344.607/02/2012 -24.28 6.146 283.608/02/2012 -28.88 12.9 324.309/02/2012 -30.33 9.25 34010/02/2012 -28.77 8.25 334.511/02/2012 -19.6 8.3 301.912/02/2012 -21.74 2.079 306.913/02/2012 -22.96 2.091 134.114/02/2012 -17.14 3.445 141.615/02/2012 -16.8 3.116 176.516/02/2012 -19.1 7.816 329.517/02/2012 -22.06 5.261 32918/02/2012 -26.47 2.847 99.819/02/2012 -19.91 5.611 109.120/02/2012 -29.94 7.534 342.221/02/2012 -33.06 3.21 345.222/02/2012 -30.21 3.705 111.6
DateAverage Temperature Wind Speed Wind Direction(°C)(m/s)(deg)23/02/2012 -24.63 6.259 11924/02/2012 -23.26 3.828 308.825/02/2012 -32.47 6.183 334.526/02/2012 -35.04 4.723 334.727/02/2012 -36.55 3.948 33828/02/2012 -34.83 1.53 301.629/02/2012 -33.44 2.35 209.401/03/2012 -34.9 2.109 317.202/03/2012 -35.47 7.715 31103/03/2012 -37.62 5.446 298.104/03/2012 -35.27 2.511 18805/03/2012 -37.34 2.117 13.3606/03/2012 -36.35 1.968 288.807/03/2012 -35.8 2.66 234.308/03/2012 -35.18 2.28 178.809/03/2012 -35.5 2.013 208.310/03/2012 -33.9 3.238 23511/03/2012 -31.35 3.109 127.612/03/2012 -33.94 3.776 341.213/03/2012 -30.79 5.314 108.114/03/2012 -19.3 9.01 130.615/03/2012 -11.1 6.258 92.616/03/2012 -20.04 12.91 342.617/03/2012 -27.43 3.713 258.618/03/2012 -25.1 2.891 45.1519/03/2012 -29.24 3.526 322.320/03/2012 -30.78 4.178 17.0721/03/2012 -22.67 9.96 67.622/03/2012 -20.41 11.23 36.1423/03/2012 -26.74 7.513 317.524/03/2012 -26.73 5.141 294.925/03/2012 -25.15 1.86 206.226/03/2012 -24.13 3.868 158.627/03/2012 -24.4 2.759 303.328/03/2012 -25.74 2.43 312.329/03/2012 -23.49 2.654 159.830/03/2012 -16.08 5.521 16231/03/2012 -14.96 6.135 128.7
DateAverage Temperature Wind Speed Wind Direction(°C)(m/s)(deg)01/04/2012 -15.13 7.781 116.602/04/2012 -15.3 5.951 111.403/04/2012 -16.09 4.309 89.604/04/2012 -15.31 2.194 90.305/04/2012 -14.35 3.771 122.106/04/2012 -8.78 5.702 165.107/04/2012 -11.64 4.486 23.6408/04/2012 -8.98 5.669 44.2909/04/2012 -21.04 7.804 347.310/04/2012 -19.39 3.618 329.811/04/2012 -16.62 4.864 219.712/04/2012 -15.04 5.648 286.613/04/2012 -21.47 5.638 311.514/04/2012 -23.71 5.282 32515/04/2012 -24.73 6.003 337.916/04/2012 -24.03 5.394 317.617/04/2012 -22.59 3.496 328.618/04/2012 -22.4 2.79 301.319/04/2012 -20.78 2.075 343.520/04/2012 -19.68 2.549 279.521/04/2012 -17.81 2.302 188.822/04/2012 -17.13 3.18 98.423/04/2012 -15.45 3.396 72.4124/04/2012 -15.3 3.185 56.525/04/2012 -14.35 2.456 65.1726/04/2012 -14.6 4.496 345.727/04/2012 -18.15 2.837 316.928/04/2012 -14.35 2.876 179.129/04/2012 -7.62 5.344 135.830/04/2012 -2.404 7.173 229.401/05/2012 -7.747 6.376 290.402/05/2012 -8.5 5.848 345.503/05/2012 -13.58 4.493 337.104/05/2012 -13.82 4.277 325.105/05/2012 -12.56 1.901 282.606/05/2012 -7.321 2.151 151.607/05/2012 -3.54 2.71 13508/05/2012 -0.806 4.124 117.1
DateAverage Temperature Wind Speed Wind Direction(°C)(m/s)(deg)09/05/2012 -0.318 3.36 118.610/05/2012 -0.699 4.791 135.711/05/2012 -2.097 8.7 123.312/05/2012 -1.184 5.031 12513/05/2012 -0.405 5.026 123.114/05/2012 -1.797 5.842 17.5315/05/2012 0.181 5.43 37.2616/05/2012 0.353 4.083 21.0817/05/2012 -2.126 4.204 9.1718/05/2012 -5.63 5.186 352.319/05/2012 -5.998 4.294 34320/05/2012 -4.302 2.346 236.521/05/2012 -4.314 4.075 46.622/05/2012 -5.17 4.829 359.823/05/2012 -5.421 2.496 246.924/05/2012 -1.211 6.347 267.825/05/2012 -6.309 8.19 2.04526/05/2012 -6.416 5.009 315.820/05/2012 -4.302 2.346 236.521/05/2012 -4.314 4.075 46.622/05/2012 -5.17 4.829 359.823/05/2012 -5.421 2.496 246.924/05/2012 -1.211 6.347 267.825/05/2012 -6.309 8.19 2.04526/05/2012 -6.416 5.009 315.830/05/2012 -0.393 5.051 239.931/05/2012 -0.045 6.051 36.7901/06/2012 -1.033 6.275 46.5302/06/2012 0.772 5.533 14.8803/06/2012 1.57 3.787 285.404/06/2012 2.217 3.412 259.805/06/2012 4.693 2.612 129.606/06/2012 4.82 2.816 200.207/06/2012 5.704 4.031 204.708/06/2012 2.801 5.537 1.48409/06/2012 1.583 4.963 33910/06/2012 1.945 5.258 0.058
DateAverage Temperature Wind Speed Wind Direction(°C)(m/s)(deg)11/06/2012 2.111 5.459 351.312/06/2012 2.125 8.49 33.5213/06/2012 2.606 7.685 348.914/06/2012 2.556 10.35 311.515/06/2012 2.621 8.09 264.716/06/2012 4.066 5.188 306.717/06/2012 5.008 3.535 14.5118/06/2012 3.445 4.297 27.819/06/2012 3.619 6.594 343.620/06/2012 5.616 3.54 300.621/06/2012 8.55 2.479 87.822/06/2012 5.536 5.162 284.223/06/2012 5.669 6.505 14.9924/06/2012 6.498 8.57 349.625/06/2012 6.445 6.712 32726/06/2012 6.717 3.604 9.3127/06/2012 6.518 5.119 336.228/06/2012 8.66 3.162 77.6129/06/2012 9.78 6.125 74.6430/06/2012 9.11 7.095 43.3601/07/2012 9.41 4.885 4.64602/07/2012 11.19 4.972 319.703/07/2012 13.3 3.154 38.5204/07/2012 16.34 2.826 41.9505/07/2012 16.95 3.114 45.8506/07/2012 14.45 3.178 168.107/07/2012 16.44 3.836 29908/07/2012 14.98 3.874 348.609/07/2012 14.6 2.843 328.610/07/2012 15.99 2.076 152.511/07/2012 15.97 2.968 13312/07/2012 15.97 3.29 139.513/07/2012 12 5.423 17.0914/07/2012 11.35 5.386 25.0115/07/2012 11.29 8.19 6.55816/07/2012 11.18 7.638 35617/07/2012 13.99 4.451 14.9418/07/2012 16.59 2.873 125
DateAverage Temperature Wind Speed Wind Direction(°C)(m/s)(deg)19/07/2012 15.09 4.91 14920/07/2012 14.65 5.672 155.521/07/2012 9.67 5.542 92.222/07/2012 10.6 7.463 18.2523/07/2012 12.39 6.635 0.0424/07/2012 10.02 7.532 296.925/07/2012 8.36 10.11 34226/07/2012 11.1 3.596 283.627/07/2012 8.13 6.492 6.58328/07/2012 8.48 5.122 62.3929/07/2012 7.822 4.929 296.630/07/2012 7.164 6.582 310.731/07/2012 7.546 5.159 3.34401/08/2012 7.385 6.62 338.902/08/2012 8.15 5.149 336.603/08/2012 10.29 4.394 13.0504/08/2012 11.94 3.198 307.405/08/2012 16.09 2.715 254.506/08/2012 14.55 5.424 78.2607/08/2012 11.15 6.486 335.608/08/2012 12.54 5.232 298.409/08/2012 16.1 7.463 253.910/08/2012 17.31 4.344 231.411/08/2012 18.63 2.63 51.9312/08/2012 14.3 6.119 11.0113/08/2012 10.16 4.978 338.114/08/2012 8.97 3.865 278.615/08/2012 9.38 4.936 265.116/08/2012 4.813 5.875 351.417/08/2012 4.977 4.64 243.318/08/2012 6.295 3.279 240.619/08/2012 11.6 3.431 148.720/08/2012 12.35 5.658 158.521/08/2012 12.66 4.397 208.122/08/2012 9.71 4.359 286.123/08/2012 9.57 3.731 29424/08/2012 9.61 5.125 287.125/08/2012 9.5 2.685 327.3
DateAverage Temperature Wind Speed Wind Direction(°C)(m/s)(deg)26/08/2012 10.5 3.191 50.9627/08/2012 10.95 4.76 13.0428/08/2012 9.55 3.345 52.0929/08/2012 9.72 4.828 122.830/08/2012 9.83 4.5 140.331/08/2012 8.47 4.423 178.301/09/2012 8.57 4.319 285.802/09/2012 9.02 7.163 247.203/09/2012 5.183 3.706 39.5404/09/2012 8.97 4.018 143.205/09/2012 7.633 2.721 178.706/09/2012 9.37 1.242 273.107/09/2012 10.68 5.515 196.408/09/2012 8.44 8.88 227.909/09/2012 8.12 4.613 318.410/09/2012 7.729 2.88 24.0611/09/2012 7.88 4.786 246.612/09/2012 7.444 3.512 140.813/09/2012 2.371 7.478 7.09414/09/2012 4.183 5.103 234.215/09/2012 4.494 6.921 285.716/09/2012 2.948 9.02 4.10117/09/2012 1.71 6.888 34618/09/2012 0.519 6.221 344.619/09/2012 0.334 2.795 85.920/09/2012 0.706 4.811 101.521/09/2012 0.448 3.806 19.3122/09/2012 0.299 2.867 30.7923/09/2012 3.164 5.148 180.624/09/2012 3.457 9.68 340.725/09/2012 0.587 7.557 5.48326/09/2012 -0.351 3.301 77.3627/09/2012 2.214 2.978 99.628/09/2012 4.266 3.632 211.229/09/2012 6.631 5.8 201.330/09/2012 6.689 4.483 269.801/10/2012 2.69 2.852 351.802/10/2012 0.336 5.203 1.407
DateAverage Temperature Wind Speed Wind Direction(°C)(m/s)(deg)03/10/2012 -1.342 7.14 341.204/10/2012 -2.622 7.611 293.605/10/2012 -1.779 3.792 22.3106/10/2012 1.009 5.679 240.307/10/2012 -1.303 6.491 5.0908/10/2012 -3.505 4.577 36009/10/2012 -2.152 1.968 340.510/10/2012 -2.319 2.728 236.611/10/2012 -3.482 4.668 15.4512/10/2012 -6.688 5.119 298.413/10/2012 -7.394 7.375 279.514/10/2012 -6.198 9.81 291.915/10/2012 -7.133 6.539 286.616/10/2012 -8.68 3.972 69.9417/10/2012 -7.984 6.644 78.0618/10/2012 -8.39 2.662 352.419/10/2012 -7.82 2.214 49.7120/10/2012 -5.405 4.448 11321/10/2012 -3.086 5.07 108.922/10/2012 -5.876 5.869 91.623/10/2012 -9.56 5.52 72.5224/10/2012 -11.38 4.288 53.5525/10/2012 -13.03 2.876 21.0226/10/2012 -13.55 1.359 345.127/10/2012 -11.08 3.985 344.428/10/2012 -10.97 10.14 332.829/10/2012 -12.6 4.191 313.330/10/2012 -11.87 2.821 172.531/10/2012 -9.27 7.632 118.801/11/2012 -14.09 5.712 27602/11/2012 -14.61 3.637 304.103/11/2012 -16.6 4.251 59.2904/11/2012 -18.82 3.425 90.305/11/2012 -10.48 5.844 179.206/11/2012 -12.48 5.814 0.31307/11/2012 -19.83 4.625 41.2508/11/2012 -15.65 4.895 34.1909/11/2012 -17.76 10.59 0.16
DateAverage Temperature Wind Speed Wind Direction(°C)(m/s)(deg)10/11/2012 -20.79 1.472 295.211/11/2012 -15.54 4.244 215.712/11/2012 -14.22 4.411 219.413/11/2012 -16.75 4.311 291.514/11/2012 -20.01 7.193 284.815/11/2012 -20.57 5.344 188.516/11/2012 -23.62 3.231 281.317/11/2012 -23.92 0.795 285.218/11/2012 -23.44 0.71 320.519/11/2012 -24.73 0.71 79.8120/11/2012 -18.2 7.667 202.521/11/2012 -15.87 7.359 21222/11/2012 -13.27 9.8 150.423/11/2012 -18.76 9.91 98.624/11/2012 -19.23 5.814 49.9525/11/2012 -27.19 6.057 69.6301/12/2012 -37.21 0.71 319.602/12/2012 -38.06 0.711 60.3303/12/2012 -29.84 2.878 317.304/12/2012 -30.86 1.057 274.405/12/2012 -27.43 1.079 16606/12/2012 -25.9 2.765 60.6807/12/2012 -28.67 5.55 352.808/12/2012 -29.9 4.533 32509/12/2012 -29.87 8.45 31710/12/2012 -27.72 9.09 304.411/12/2012 -27.75 5.968 31612/12/2012 -29.64 3.923 321.113/12/2012 -32.74 1.742 319.314/12/2012 -34.47 3.516 11815/12/2012 -27.53 9.08 128.816/12/2012 -17 10.5 126.217/12/2012 -17.89 4.172 329.718/12/2012 -22.73 3.243 127.419/12/2012 -23.94 2.488 104.220/12/2012 -19.09 2.574 352.721/12/2012 -16.56 4.042 357.822/12/2012 -17.01 5.7 337
DateAverage Temperature Wind Speed Wind Direction(°C)(m/s)(deg)23/12/2012 -20.09 9.54 345.224/12/2012 -24.18 12.3 351.525/12/2012 -23.95 12.71 354.526/12/2012 -19.11 7.354 0.87727/12/2012 -16.05 4.703 26.5828/12/2012 -17.74 5.744 11829/12/2012 -23.67 3.725 90.630/12/2012 -23.69 2.34 349.431/12/2012 -20.13 2.346 192.1
TECHNICAL MEMORANDUMAgnico Eagle Mines Ltd: Meadowbank DivisionBaker Lake, Nunavut, X0C 0A0Date: March 6, 2013Subject: 2012 Preliminary evaluation of dustfall along the Meadowbank AWARFrom: Ryan VanEngen (Environment Biologist), Kevin Buck (Environment Superintendent) andLeilan Baxter (AEM Consultant)1 Introduction1.1 BackgroundSince 2009, AEM has maintained a 105 km All Weather Access Road (AWAR) between thehamlet of Baker Lake and the Meadowbank Mine site. In 2012, the hamlet raised concernsabout high dust levels along the AWAR near the community (between barge laydown area toBaker Lake Gatehouse). In response, AEM provided calcium chloride to the hamlet forapplication in 2012. In addition, AEM conducted a preliminary dustfall study along arepresentative section of the AWAR which augmented regular dustfall monitoring around themine site. A larger‐scale study will be conducted in 2013 to further evaluate the spatial extentsof dustfall and potential for impacts to the terrestrial ecosystem.AEM’s <strong>NIRB</strong> project certificate (Condition 74) states that “Cumberland (now AEM) shallemploy environmentally protective techniques to suppress any surface road dust”. To date,these techniques have included the enforcement of speed limits along the AWAR, the routineuse of water trucks around the mine site where the heaviest year‐round traffic occurs and theuse of dust suppressants on camp roads.Detailed modelling of air quality was conducted for the Vault haul road as part of theMeadowbank air quality impact assessment (Cumberland, 2005), because this was expected tobe the most frequently used road. The model predicted that the worst case level of air pollution(mainly fugitive dust) will be in the range of, or less than the GN air quality objectives.Evaluation and monitoring of fugitive dust along the AWAR was not required, because muchlower traffic volumes were planned for this route.1.2 Potential Effects of DustfallImpacts of dustfall from roadways in the north have been examined in a number of studies;most notably, a series of long‐term investigations along Alaska’s Dalton Highway, beginning in1976 (Walker and Everett, 1987; Auerbach et al. 1997; Myers‐Smith et al., 2006). It should benoted that no estimations of the duration of road use, or quantity of dust deposition required1 | Page
to induce changes in vegetation were found in the literature to this point. With the exception ofone study at the Ekati Diamond Mine (Male and Nol, 2006), the majority of studies haveoccurred after 10+ years of road use (Male and Nol, 2006 – 4 yr; Auerbach et al., 1997 ‐ 15 yr;Myers‐Smith et al. 2006 ‐ 25 yr), and many of these researchers indicate that changes invegetative cover are likely to become more pronounced over time. While it is likely thatsignificantly more dust is created on this highway than Meadowbank’s AWAR, effects would beexpected to occur through similar mechanisms if deposition rates were sufficient to impact thesurrounding environment. These effects may include earlier snowmelt, change in soil moistureand pH, and reduced moss and lichen cover. Based on the literature reviewed, these potentialeffects would most likely be confined to within 300 m of the roadway.AEM’s Terrestrial Ecosystem Impact Assessment (TEIA) (Cumberland, 2005) predictedlocalized “bird habitat degradation and vegetation degradation due to dust and exhaust” nearhaul roads and the access road due to traffic. The magnitude of the effects was determined tobe low which is consistent with the effects of fugitive dust observed at Ekati (Male and Nol,2006). Further details on potential effects were provided in a Technical Memorandum providedto <strong>NIRB</strong> from AEM as part of the AEM’s responses to the <strong>NIRB</strong> annual report recommendations,dated December 21, 2012.1.3 Study ObjectivesThe overall goals of the Meadowbank dustfall studies (2012, 2013) are to address <strong>NIRB</strong>recommendations (AEM letter to <strong>NIRB</strong> dated December 7, 2012), and for development offuture mitigative and management actions. The objectives of the study conducted in 2012 wereto:1. Characterize the dustfall gradient in relation to distance from the AWAR2. Compare rates of dustfall on the minesite with those along the AWAR3. Develop methods for dustfall sample collection, taking into account recommendedstandard procedures and practical considerations (collection at ground level comparedto 2 m height)4. Compare rates of dustfall along the AWAR with regulatory guidelines2 Methods2.1 Sample Collection and AnalysisDustfall was collected in open vessels containing a purified liquid matrix provided by anaccredited laboratory (Maxxam Analytics). Particles are deposited and retained in the liquid,which was then analyzed by the accredited laboratory for total and fixed (non‐combustible)dustfall. For the 2012 study, dustfall canisters were deployed from August 18 – September 15,2012. Calculated dustfall rates are normalized to 30 days (mg/cm 2 /30 days). ASTM (and OntarioMOE) methods suggest collection of the sample at 2‐3 m height on a utility pole to prevent re‐2 | Page
entrainment of particulates from the ground, and to reduce vandalism. Due to the difficulty ofconstructing and deploying stands to hold the sample containers in this remote location, the2012 study compared dustfall at ground level and at 2 m height to assist in the development offuture sampling method decisions.2.2 Sample LocationsThe primary objective of the dustfall study was to characterize dust deposition based onproximity to the roadway. To fulfill this objective, samples were collected at 50 m intervals to adistance of 100 or 150 m on either side (west or east) of the AWAR, at two locations (km 76 andkm 78). This section of the road is relatively straight with few notable topographical features,which limited confounding factors that alter prevailing winds and prevented micro‐climatesfrom influencing dust deposition.The secondary objective of the study was to compare rates of dustfall on the minesitewith those along the AWAR. To address this objective, dustfall samples were collected at twolocations on the minesite (DF‐1 and DF‐2).Lastly, the study aimed to compare collection at 2 m height (on a constructed woodenstand; the ASTM recommended method) and at ground level, which is more practical for thecollection of a large number of samples in remote locations. To fulfill this objective, one of thecanisters at 100 m at each AWAR location (km 76, km 78) was duplicated with a canister on a 2m stand. At the minesite locations (DF‐1 and DF‐2), three canisters were placed on the groundsurrounding one on a stand.Sample locations are shown in Figure 1 and 2. See Section 4 for a summary of the samplenames, height above ground, and distance from road (Table 1).2.3 Data AnalysisAll statistical analyses were performed using SigmaPlot 11 software. Samples collected on theground at the AWAR sites (km 76, km78) were used to examine the effects of distance from theroad (50, 100, 150 m) by one‐way ANOVA, and side of the road (east or west) by t‐test on totaland fixed dustfall. Samples from the two sites were pooled for this analysis. Mean dustfall insamples collected on the ground at each mine site location (DF‐1, DF‐2) were not significantlydifferent from each other, so were pooled and compared to samples collected on the ground ateach distance from the road to compare dustfall onsite with dustfall along the road by one‐wayANOVA. In all statistical tests, α = 0.05 was used. For AWAR locations, samples collected on thestand were compared qualitatively to the corresponding ground‐level sample. For mine sitelocations, all ground‐level samples were collected at approximately the same distance from thestand, so the mean ground‐level dustfall was used in the comparison.2.4 Regulatory GuidelinesNo standards for dustfall are available for Nunavut. Results of the total dustfall analysis werecompared to Alberta Environment’s ambient air quality guideline (February, 2013) for3 | Page
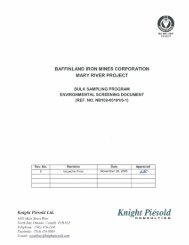
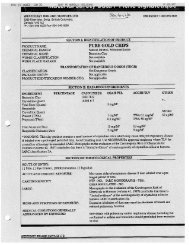
ecreational areas of 0.53 mg/cm 2 /30d, and the commercial/industrial area guideline of 1.58mg/cm 2 /30d. These guidelines were developed in 1975 and the origin of their derivation couldnot be traced. Further, these values are based on “nuisance”, rather than the protection ofenvironmental or human health (Laura Blair, AENV, pers.comm. March 2013). Because of thesefactors, the guidelines are included to provide context only.3 ResultsThirty‐day normalized rates of total and fixed dustfall for all locations are provided in Table 1.Sample 76B and 78D are the corresponding ground samples for the stands at sites km 76 andkm 78, respectively.Table 1. Sample site characteristics and thirty‐day normalized rates of total and fixed dustfall collectedfrom Aug‐Sept, 2012 at the Meadowbank sites (DF‐1 and DF‐2) and all‐weather access road sites (km76 and km 78). Corresponding stand and ground samples for AWAR locations are highlighted in greyand tan. At minesite locations, ground samples were grouped around the stand at equal distances.SiteNameSampleNameGround orStandDistancefrom RoadSide ofRoadTotal Dustfall(mg/cm 2 /30d)Fixed Dustfall(mg/cm 2 /30d)DF‐1 1 Stand n/a n/a 0.307 0.2681A Ground n/a n/a 0.189 0.1501B Ground n/a n/a 0.496 0.4571C Ground n/a n/a 0.417 0.362DF‐2 2 Stand n/a n/a 0.205 0.1422A Ground n/a n/a 0.338 0.2912B Ground n/a n/a 0.291 0.2442C Ground n/a n/a 0.480 0.441km 76 76 Stand 100 m E 0.114 0.09076A Ground 150 m E 0.556 0.48276B Ground 100 m E 0.302 0.25376C Ground 50 m E 1.069 1.02976D Ground 50 m W 1.029 0.98876E Ground 100 m W 0.669 0.637km 78 78 Stand 100 m W 0.963 0.82478A Ground 100 m E 0.710 0.58078B Ground 50 m E 1.469 1.24978C Ground 50 m W 0.955 0.92278D Ground 100 m W 0.180 0.16378E Ground 150 m W 0.449 0.3924 | Page
Turn LakeWally LakeLegend!(<strong>Air</strong> Quality & Dust<strong>Monitoring</strong> Location2012 As Built Mine PlanSouth Camp DikeQuarry!(DF-1AWPAR QuarryDewatered Lake!(DF-4Portage Attenuation FacilityTailings Storage FacilityRoadsDrilltrail LakeAWPARNP2Dogleg NorthDikesStockpilesMine Pit Updated AreaFacility<strong>Air</strong>stripPortage Rock Storage FacilityDogleg PondNorthBasinDF-2!(!(DF-3Second Portage Lake<strong>Air</strong> Quality & Dust<strong>Monitoring</strong> LocationsThird Portage LakeBayGooseBasin0 0.5 1 2KilometresEastBasinPROJECT: DA11-062-03CLIENT: Agnico-Eagle Mines Ltd., Meadowbank Div.²DATE: MARCH 2013SCALE: 1:35,000DRAWN BY: LCCHECKED BY: TFUTM Zone 14 NAD83FIGURE:1The information displayed on this map has been compiled from varioussources. While every effort has been made to accurately depict theinformation, this map should not be relied on as being a preciseindicator of locations, features, or roads, nor as a guide to navigation.MNR data provided by Queen's Printer of Ontario. Use of the data in anyderivative product does not constitute an endorsement by the MNR orthe Ontario Government of such products.
3.1 Distance from RoadMean total dustfall was significantly greater at 50 m from the road (1.13 mg/cm 2 /30d), than at100 m (0.47 mg/cm 2 /30d) and 150 m (0.50 mg/cm 2 /30d), which were not significantly differentfrom each other in the one‐way ANOVA analysis. Variability was notably highest at the 100 mlocation, with a coefficient of variation of 56%, compared to 20% at 50 m, and 14% at 150 m.Variability between the samples at 100 m were not due to the side of the road the sample wastaken on (see Section 2.2). Similar trends were seen for fixed dustfall.3.2 Side of the RoadMean total dustfall was 0.82 mg/cm 2 /30d on the east side, and 0.66 mg/cm 2 /30d on the westside of the road. The difference was not statistically significant. No differences were foundwhen groups at each distance from the road were examined individually. Similar results wereobtained for fixed dustfall.3.3 Onsite vs. AWAR SitesMean total dustfall onsite was 0.37 mg/cm 2 /30d, which was significantly less than dustfall at 50m from the roadway (1.13 mg/cm 2 /30d). No significant difference was found between dustfallonsite and dustfall at 100 m or 150 m from the road (see Section 3.1 for mean rates). Similarresults were obtained for fixed dustfall.3.4 Height Above GroundOnsite, mean total dustfall at ground level (0.37 mg/cm 2 /30d at DF‐1 and DF‐2) was greaterthan at 2 m above ground for DF‐1 and DF‐2 (0.31 and 0.20 mg/cm 2 /30d, respectively).Along the AWAR, stands were placed at the 100 m location, which had the highestvariability between samples (see Section 3.1). Total dustfall rates on the two stands were thehighest (0.96 mg/cm 2 /30d ‐ km 78) and lowest (0.11 mg/cm 2 /30d ‐ km 76) rates observed at the100 m location. Dustfall on the ground at km 76 (76B) was approximately twice as high asdustfall on the stand. However at km 78, dustfall on the ground (78D) was approximately fivetimes lower than dustfall on the stand (see Table 1). Ratios were similar for total and fixeddustfall. No statistical correlations were found between rates of dustfall on stands and those onthe ground.3.5 Comparison to Regulatory GuidelinesNo samples collected from onsite locations or from the 150 m locations exceeded therecreational area guideline of 0.53 mg/cm 2 /30d. At the 100 m location, half of the samplesexceeded the recreational guideline, but none exceeded the commercial/industrial guideline of1.58 mg/cm 2 /30d. At the 50 m location, all samples exceeded the recreational area guideline,but none exceeded the commercial/industrial guideline.7 | Page
4 ConclusionsThe results of this preliminary study will assist in the development of methods for the studyproposed for 2013.Notably, 30‐d rates of dust deposition at 50 m from the Meadowbank AWAR were morethan 20 x lower than those reported along Ekati Diamond Mine haul roads in 2003(extrapolated from 72‐h studies; 0.7 g/m 2 /day; Male and Nol, 2005). Furthermore, reporteddust depositions along Ekati haul roads after application of dust suppressants (extrapolatedfrom 72‐h studies; 0.2 g/m 2 /day; Male and Nol, 2005) was still more than 4 x higher thanobserved along Meadowbank’s AWAR in this study. Overall, rates of dustfall along the AWARwere within the range of Alberta Environment’s ambient air quality guidelines (recreational orindustrial).Side of the road (East or West) results were not significantly different at any distance.However, it is highly probable that in actuality one side receives higher dustfall than the otherdue to prevailing winds, and the sample size in 2012 was too low to detect a difference. In the2013 study, data will first be screened based on this variable before pooling for analyses ofother variables. Topographical differences will be taken into account as well.Since dustfall at minesite locations was lower than any sampling position along theAWAR, the 2013 study will primarily focus on locations away from the minesite and at newlocations along the Vault Pit haul road.In this preliminary study, dustfall collection at ground level generally appeared toprovide comparable estimates of dustfall to those obtained at 2 m height (and was moreconservative in 3 of 4 cases). Based on these results and the reasons described in guidancedocuments for mounting dust canisters at 2 – 3 m height, this practice appears to be generallyconservative, and could be employed in future studies.Finally, in this study, distance from the road significantly affected recorded rates ofdustfall. Since dustfall rates were not significantly different between 100 and 150 m from theroad, and these rates were not significantly different from those at the minesite, it is likely thatelevated rates of dustfall are confined to < 100 m from the road. This is in agreement with TEIApredictions (Cumberland, 2005) and Male and Nol (2005) who found the most pronounceddustfall rates within 50 m of roads at the Ekati mine site. Despite higher levels of dustdeposition at Ekati, Male and Nol (2005) did not find a measurable effect of roads on Laplandlongspurs. Similar results were reported in AEM (2012) for the 2011 AWAR Meadowbankbreeding bird survey that found higher bird diversity within 150m of the east side compared tothe west side of the road and no road related effects on bird abundance (eg. Lapland longspurabundance) or richness (AEM, 2012). The 2013 study will therefore focus on distance from theroad and may include a sampling location beyond 150 m, based on evidence in the literaturethat effects may extend to 300 m from roadways.8 | Page
As predicted and evaluated in the TEIA (Cumberland, 2005), one potential concern withincreased dustfall along the road may be the re‐entrainment of contaminants that occurnaturally in the rock used for road construction, or in materials used to suppress dust, that maycause effects to receptors such as birds, predatory mammals or ungulates. Concentrations ofchromium in Meadowbank area soil have been found to be naturally elevated (above CCMEguidelines), and traffic could cause increased deposition on surface soil and vegetation. In 2012,AEM conducted a wildlife screening level risk assessment to quantify risk to identified receptorsof concern, which included songbirds, waterfowl, ungulates and small mammals.Concentrations of contaminants examined in the study were not elevated in samples onsite ornear site, and no risks to wildlife health through contaminant exposure were identified due tomine activities.5 ReferencesAgnico‐Eagle Mines (AEM) (2012). Meadowbank Gold Project‐ 2011 Annual Report Preparedfor the Nunavut Impact Review Board. <strong>App</strong>endix H‐ Meadowbank Mine. 2011 Wildlife<strong>Monitoring</strong> Summary Report. Prepared by Nunavut Environmental Consulting Ltd. March 2012.Cumberland (2005). Meadowbank Gold Project ‐ <strong>Air</strong> quality Impact Assessment‐ completed byGolder Associates and submitted on October 2005Cumberland (2005). Meadowbank Gold Project‐ Terrestrial Ecosystem Impact Assessment –Completed by Golder Associates and submitted on October 2005Auerbach, N., Walker, M. and D. Walker. 1997. Effects of roadside disturbance on substrate andvegetation properties in Arctic tundra. Ecological <strong>App</strong>lications. 7(1):218‐235.Male, S. and E. Nol. 2005. Impacts of roads associated with the Ekati Diamond Mine, NorthwestTerritories, Canada, on reproductive success and breeding habitat of Lapland longspurs.Canadian Journal of Zoology 83:1286‐1296.Myers‐Smith, I. and B. Arnesen. 2006. Cumulative impacts on Alaskan arctic tundra of a quartercentury of road dust. Ecoscience 13(3):503‐510.Walker, D. and K. Everett. 1987. Road dust and its environmental impact on Alaskan taiga andtundra. Arctic and Alpine Research 19(4):479‐489.9 | Page