130419-03MN107-App G7 Air Monitoring-IA2E.pdf - NIRB
130419-03MN107-App G7 Air Monitoring-IA2E.pdf - NIRB
130419-03MN107-App G7 Air Monitoring-IA2E.pdf - NIRB
You also want an ePaper? Increase the reach of your titles
YUMPU automatically turns print PDFs into web optimized ePapers that Google loves.
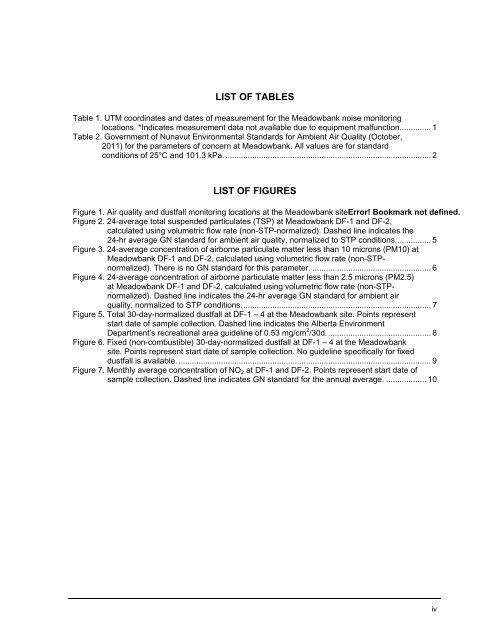
LIST OF TABLESTable 1. UTM coordinates and dates of measurement for the Meadowbank noise monitoringlocations. *Indicates measurement data not available due to equipment malfunction. ............. 1Table 2. Government of Nunavut Environmental Standards for Ambient <strong>Air</strong> Quality (October,2011) for the parameters of concern at Meadowbank. All values are for standardconditions of 25°C and 101.3 kPa. ............................................................................................ 2LIST OF FIGURESFigure 1. <strong>Air</strong> quality and dustfall monitoring locations at the Meadowbank siteError! Bookmark not defined.Figure 2. 24-average total suspended particulates (TSP) at Meadowbank DF-1 and DF-2,calculated using volumetric flow rate (non-STP-normalized). Dashed line indicates the24-hr average GN standard for ambient air quality, normalized to STP conditions. ............... 5Figure 3. 24-average concentration of airborne particulate matter less than 10 microns (PM10) atMeadowbank DF-1 and DF-2, calculated using volumetric flow rate (non-STPnormalized).There is no GN standard for this parameter. ..................................................... 6Figure 4. 24-average concentration of airborne particulate matter less than 2.5 microns (PM2.5)at Meadowbank DF-1 and DF-2, calculated using volumetric flow rate (non-STPnormalized).Dashed line indicates the 24-hr average GN standard for ambient airquality, normalized to STP conditions. .................................................................................... 7Figure 5. Total 30-day-normalized dustfall at DF-1 – 4 at the Meadowbank site. Points representstart date of sample collection. Dashed line indicates the Alberta EnvironmentDepartment’s recreational area guideline of 0.53 mg/cm 2 /30d. .............................................. 8Figure 6. Fixed (non-combustible) 30-day-normalized dustfall at DF-1 – 4 at the Meadowbanksite. Points represent start date of sample collection. No guideline specifically for fixeddustfall is available. ................................................................................................................. 9Figure 7. Monthly average concentration of NO 2 at DF-1 and DF-2. Points represent start date ofsample collection. Dashed line indicates GN standard for the annual average. .................. 10iv


