Patent Landscape Report on Ritonavir - WIPO
Patent Landscape Report on Ritonavir - WIPO
Patent Landscape Report on Ritonavir - WIPO

Create successful ePaper yourself
Turn your PDF publications into a flip-book with our unique Google optimized e-Paper software.
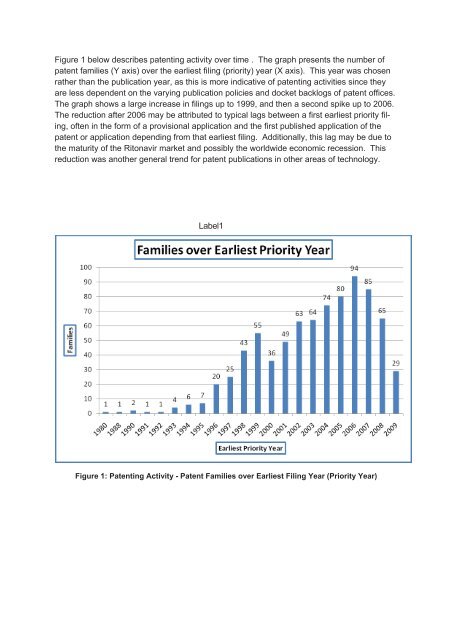
Figure 1 below describes patenting activity over time . The graph presents the number ofpatent families (Y axis) over the earliest filing (priority) year (X axis). This year was chosenrather than the publicati<strong>on</strong> year, as this is more indicative of patenting activities since theyare less dependent <strong>on</strong> the varying publicati<strong>on</strong> policies and docket backlogs of patent offices.The graph shows a large increase in filings up to 1999, and then a sec<strong>on</strong>d spike up to 2006.The reducti<strong>on</strong> after 2006 may be attributed to typical lags between a first earliest priority filing,often in the form of a provisi<strong>on</strong>al applicati<strong>on</strong> and the first published applicati<strong>on</strong> of thepatent or applicati<strong>on</strong> depending from that earliest filing. Additi<strong>on</strong>ally, this lag may be due tothe maturity of the Rit<strong>on</strong>avir market and possibly the worldwide ec<strong>on</strong>omic recessi<strong>on</strong>. Thisreducti<strong>on</strong> was another general trend for patent publicati<strong>on</strong>s in other areas of technology.Label1Figure 1: <str<strong>on</strong>g>Patent</str<strong>on</strong>g>ing Activity - <str<strong>on</strong>g>Patent</str<strong>on</strong>g> Families over Earliest Filing Year (Priority Year)