
Create successful ePaper yourself
Turn your PDF publications into a flip-book with our unique Google optimized e-Paper software.
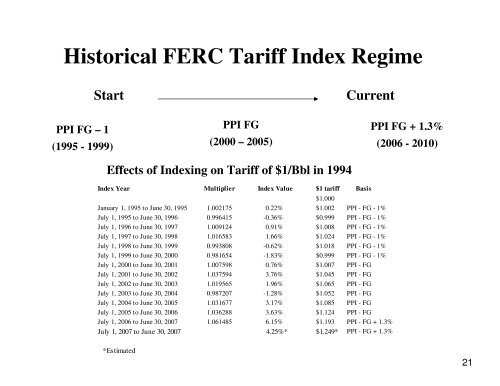
Historical FERC Tariff Index RegimeStartCurrentPPI FG – 1(1995 - 1999)PPI FG(2000 – 2005)PPI FG + 1.3%(2006 - 2010)Effects of Indexing on Tariff of $1/Bbl in 1994Index Year Multiplier Index Value $1 tariff Basis$1.000January 1, 1995 to June 30, 1995 1.002175 0.22% $1.002 PPI - FG - 1%July 1, 1995 to June 30, 1996 0.996415 -0.36% $0.999 PPI - FG - 1%July 1, 1996 to June 30, 1997 1.009124 0.91% $1.008 PPI - FG - 1%July 1, 1997 to June 30, 1998 1.016583 1.66% $1.024 PPI - FG - 1%July 1, 1998 to June 30, 1999 0.993808 -0.62% $1.018 PPI - FG - 1%July 1, 1999 to June 30, 2000 0.981654 -1.83% $0.999 PPI - FG - 1%July 1, 2000 to June 30, 2001 1.007598 0.76% $1.007 PPI - FGJuly 1, 2001 to June 30, 2002 1.037594 3.76% $1.045 PPI - FGJuly 1, 2002 to June 30, 2003 1.019565 1.96% $1.065 PPI - FGJuly 1, 2003 to June 30, 2004 0.987207 -1.28% $1.052 PPI - FGJuly 1, 2004 to June 30, 2005 1.031677 3.17% $1.085 PPI - FGJuly 1, 2005 to June 30, 2006 1.036288 3.63% $1.124 PPI - FGJuly 1, 2006 to June 30, 2007 1.061485 6.15% $1.193 PPI - FG + 1.3%July 1, 2007 to June 30, 2007 4.25%* $1.249* PPI - FG + 1.3%*Estimated21