Fibrillogenic and Non-fibrillogenic Ensembles of SDS ... - CCMB
Fibrillogenic and Non-fibrillogenic Ensembles of SDS ... - CCMB
Fibrillogenic and Non-fibrillogenic Ensembles of SDS ... - CCMB

Create successful ePaper yourself
Turn your PDF publications into a flip-book with our unique Google optimized e-Paper software.
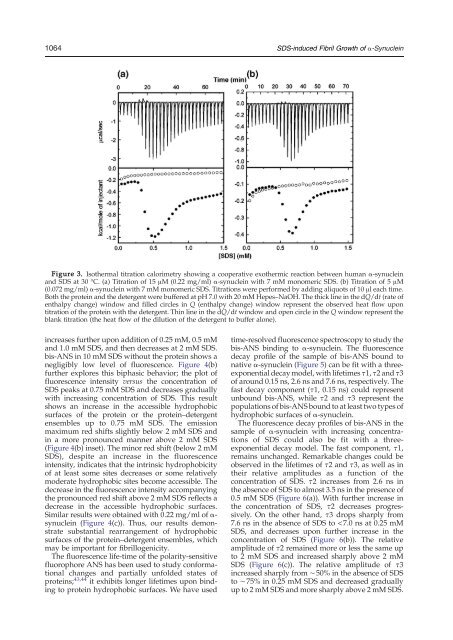
1064 <strong>SDS</strong>-induced Fibril Growth <strong>of</strong> a-SynucleinFigure 3. Isothermal titration calorimetry showing a cooperative exothermic reaction between human α-synuclein<strong>and</strong> <strong>SDS</strong> at 30 °C. (a) Titration <strong>of</strong> 15 μM (0.22 mg/ml) α-synuclein with 7 mM monomeric <strong>SDS</strong>. (b) Titration <strong>of</strong> 5 μM(0.072 mg/ml) α-synuclein with 7 mM monomeric <strong>SDS</strong>. Titrations were performed by adding aliquots <strong>of</strong> 10 μl each time.Both the protein <strong>and</strong> the detergent were buffered at pH 7.0 with 20 mM Hepes–NaOH. The thick line in the dQ/dt (rate <strong>of</strong>enthalpy change) window <strong>and</strong> filled circles in Q (enthalpy change) window represent the observed heat flow upontitration <strong>of</strong> the protein with the detergent. Thin line in the dQ/dt window <strong>and</strong> open circle in the Q window represent theblank titration (the heat flow <strong>of</strong> the dilution <strong>of</strong> the detergent to buffer alone).increases further upon addition <strong>of</strong> 0.25 mM, 0.5 mM<strong>and</strong> 1.0 mM <strong>SDS</strong>, <strong>and</strong> then decreases at 2 mM <strong>SDS</strong>.bis-ANS in 10 mM <strong>SDS</strong> without the protein shows anegligibly low level <strong>of</strong> fluorescence. Figure 4(b)further explores this biphasic behavior; the plot <strong>of</strong>fluorescence intensity versus the concentration <strong>of</strong><strong>SDS</strong> peaks at 0.75 mM <strong>SDS</strong> <strong>and</strong> decreases graduallywith increasing concentration <strong>of</strong> <strong>SDS</strong>. This resultshows an increase in the accessible hydrophobicsurfaces <strong>of</strong> the protein or the protein–detergentensembles up to 0.75 mM <strong>SDS</strong>. The emissionmaximum red shifts slightly below 2 mM <strong>SDS</strong> <strong>and</strong>in a more pronounced manner above 2 mM <strong>SDS</strong>(Figure 4(b) inset). The minor red shift (below 2 mM<strong>SDS</strong>), despite an increase in the fluorescenceintensity, indicates that the intrinsic hydrophobicity<strong>of</strong> at least some sites decreases or some relativelymoderate hydrophobic sites become accessible. Thedecrease in the fluorescence intensity accompanyingthe pronounced red shift above 2 mM <strong>SDS</strong> reflects adecrease in the accessible hydrophobic surfaces.Similar results were obtained with 0.22 mg/ml <strong>of</strong> α-synuclein (Figure 4(c)). Thus, our results demonstratesubstantial rearrangement <strong>of</strong> hydrophobicsurfaces <strong>of</strong> the protein–detergent ensembles, whichmay be important for <strong>fibrillogenic</strong>ity.The fluorescence life-time <strong>of</strong> the polarity-sensitivefluorophore ANS has been used to study conformationalchanges <strong>and</strong> partially unfolded states <strong>of</strong>proteins; 43,44 it exhibits longer lifetimes upon bindingto protein hydrophobic surfaces. We have usedtime-resolved fluorescence spectroscopy to study thebis-ANS binding to α-synuclein. The fluorescencedecay pr<strong>of</strong>ile <strong>of</strong> the sample <strong>of</strong> bis-ANS bound tonative α-synuclein (Figure 5) can be fit with a threeexponentialdecay model, with lifetimes τ1, τ2 <strong>and</strong> τ3<strong>of</strong> around 0.15 ns, 2.6 ns <strong>and</strong> 7.6 ns, respectively. Thefast decay component (τ1, 0.15 ns) could representunbound bis-ANS, while τ2 <strong>and</strong> τ3 represent thepopulations <strong>of</strong> bis-ANS bound to at least two types <strong>of</strong>hydrophobic surfaces <strong>of</strong> α-synuclein.The fluorescence decay pr<strong>of</strong>iles <strong>of</strong> bis-ANS in thesample <strong>of</strong> α-synuclein with increasing concentrations<strong>of</strong> <strong>SDS</strong> could also be fit with a threeexponentialdecay model. The fast component, τ1,remains unchanged. Remarkable changes could beobserved in the lifetimes <strong>of</strong> τ2 <strong>and</strong> τ3, as well as intheir relative amplitudes as a function <strong>of</strong> theconcentration <strong>of</strong> <strong>SDS</strong>. τ2 increases from 2.6 ns inthe absence <strong>of</strong> <strong>SDS</strong> to almost 3.5 ns in the presence <strong>of</strong>0.5 mM <strong>SDS</strong> (Figure 6(a)). With further increase inthe concentration <strong>of</strong> <strong>SDS</strong>, τ2 decreases progressively.On the other h<strong>and</strong>, τ3 drops sharply from7.6 ns in the absence <strong>of</strong> <strong>SDS</strong> to