Fibrillogenic and Non-fibrillogenic Ensembles of SDS ... - CCMB
Fibrillogenic and Non-fibrillogenic Ensembles of SDS ... - CCMB
Fibrillogenic and Non-fibrillogenic Ensembles of SDS ... - CCMB

Create successful ePaper yourself
Turn your PDF publications into a flip-book with our unique Google optimized e-Paper software.
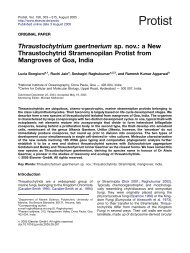
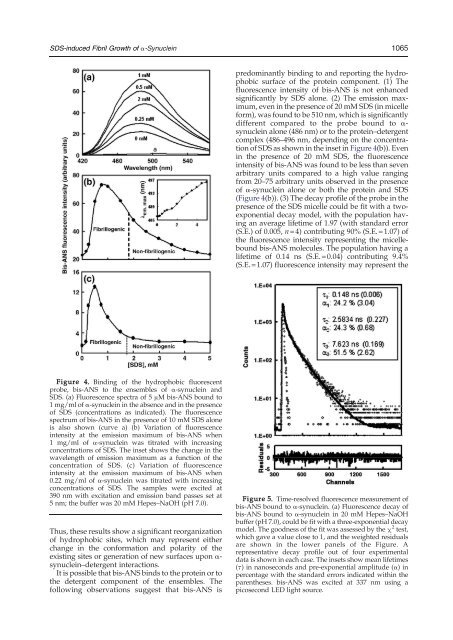
<strong>SDS</strong>-induced Fibril Growth <strong>of</strong> a-Synuclein1065predominantly binding to <strong>and</strong> reporting the hydrophobicsurface <strong>of</strong> the protein component. (1) Thefluorescence intensity <strong>of</strong> bis-ANS is not enhancedsignificantly by <strong>SDS</strong> alone. (2) The emission maximum,even in the presence <strong>of</strong> 20 mM <strong>SDS</strong> (in micelleform), was found to be 510 nm, which is significantlydifferent compared to the probe bound to α-synuclein alone (486 nm) or to the protein–detergentcomplex (486–496 nm, depending on the concentration<strong>of</strong> <strong>SDS</strong> as shown in the inset in Figure 4(b)). Evenin the presence <strong>of</strong> 20 mM <strong>SDS</strong>, the fluorescenceintensity <strong>of</strong> bis-ANS was found to be less than sevenarbitrary units compared to a high value rangingfrom 20–75 arbitrary units observed in the presence<strong>of</strong> α-synuclein alone or both the protein <strong>and</strong> <strong>SDS</strong>(Figure 4(b)). (3) The decay pr<strong>of</strong>ile <strong>of</strong> the probe in thepresence <strong>of</strong> the <strong>SDS</strong> micelle could be fit with a twoexponentialdecay model, with the population havingan average lifetime <strong>of</strong> 1.97 (with st<strong>and</strong>ard error(S.E.) <strong>of</strong> 0.005, n=4) contributing 90% (S.E.=1.07) <strong>of</strong>the fluorescence intensity representing the micelleboundbis-ANS molecules. The population having alifetime <strong>of</strong> 0.14 ns (S.E.=0.04) contributing 9.4%(S.E.=1.07) fluorescence intensity may represent theFigure 4. Binding <strong>of</strong> the hydrophobic fluorescentprobe, bis-ANS to the ensembles <strong>of</strong> α-synuclein <strong>and</strong><strong>SDS</strong>. (a) Fluorescence spectra <strong>of</strong> 5 μM bis-ANS bound to1 mg/ml <strong>of</strong> α-synuclein in the absence <strong>and</strong> in the presence<strong>of</strong> <strong>SDS</strong> (concentrations as indicated). The fluorescencespectrum <strong>of</strong> bis-ANS in the presence <strong>of</strong> 10 mM <strong>SDS</strong> aloneis also shown (curve a) (b) Variation <strong>of</strong> fluorescenceintensity at the emission maximum <strong>of</strong> bis-ANS when1 mg/ml <strong>of</strong> α-synuclein was titrated with increasingconcentrations <strong>of</strong> <strong>SDS</strong>. The inset shows the change in thewavelength <strong>of</strong> emission maximum as a function <strong>of</strong> theconcentration <strong>of</strong> <strong>SDS</strong>. (c) Variation <strong>of</strong> fluorescenceintensity at the emission maximum <strong>of</strong> bis-ANS when0.22 mg/ml <strong>of</strong> α-synuclein was titrated with increasingconcentrations <strong>of</strong> <strong>SDS</strong>. The samples were excited at390 nm with excitation <strong>and</strong> emission b<strong>and</strong> passes set at5 nm; the buffer was 20 mM Hepes–NaOH (pH 7.0).Thus, these results show a significant reorganization<strong>of</strong> hydrophobic sites, which may represent eitherchange in the conformation <strong>and</strong> polarity <strong>of</strong> theexisting sites or generation <strong>of</strong> new surfaces upon α-synuclein–detergent interactions.It is possible that bis-ANS binds to the protein or tothe detergent component <strong>of</strong> the ensembles. Thefollowing observations suggest that bis-ANS isFigure 5. Time-resolved fluorescence measurement <strong>of</strong>bis-ANS bound to α-synuclein. (a) Fluorescence decay <strong>of</strong>bis-ANS bound to α-synuclein in 20 mM Hepes–NaOHbuffer (pH 7.0), could be fit with a three-exponential decaymodel. The goodness <strong>of</strong> the fit was assessed by the χ 2 test,which gave a value close to 1, <strong>and</strong> the weighted residualsare shown in the lower panels <strong>of</strong> the Figure. Arepresentative decay pr<strong>of</strong>ile out <strong>of</strong> four experimentaldata is shown in each case. The insets show mean lifetimes(τ) in nanoseconds <strong>and</strong> pre-exponential amplitude (α) inpercentage with the st<strong>and</strong>ard errors indicated within theparentheses. bis-ANS was excited at 337 nm using apicosecond LED light source.