Real Degree of Fermentability - The Institute of Brewing & Distilling ...
Real Degree of Fermentability - The Institute of Brewing & Distilling ...
Real Degree of Fermentability - The Institute of Brewing & Distilling ...

Create successful ePaper yourself
Turn your PDF publications into a flip-book with our unique Google optimized e-Paper software.
<strong>Real</strong> <strong>Degree</strong> <strong>of</strong> <strong>Fermentability</strong>Nathan Calman 1 , Megan Sheehy 2 , Sophie Roumeliotis 3 , Jason Eglinton 3 , Doug Stewart 21. Lion Nathan Ltd., 29 Nyrang St. Lidcombe, NSW 21412. Joe White Malting’s Pty Ltd., 124-130 South Tce., Adelaide, SA 50003. School <strong>of</strong> Agriculture Food and Wine, Waite Campus, University <strong>of</strong> Adelaide, Glen Osmond,SA 5064Abstract:Variation in malt fermentability in the brewery is a significant problem for brewers. A 71 o CInfusion mashing pr<strong>of</strong>ile was found to be the best laboratory prediction method <strong>of</strong> maltfermentability used in Carlsberg Brewery, Kuala Lumpur, Malaysia for eighteen samples underinvestigation. Of the malt quality parameters investigated, initial starch gelatinisationtemperature was shown to be most closely correlated with, fermentability. Total Beta AmylaseActivity, Percentage Beta Amylase Activity, Percentage Kolbach Index and Initial StarchGelatinisation Temperature were identified for use in a multi linear regression analysis for theprediction <strong>of</strong> malt fermentability, accounting for 81.7% <strong>of</strong> brewery fermentability variation.Barley malt fermentability was shown to be negatively affected by poor environmental growthconditions. Significantly, genotype by environment interaction for each <strong>of</strong> the ten varieties underinvestigation appeared to control the effect <strong>of</strong> environmental conditions on fermentability.Introduction:Malt fermentability is a key parameter <strong>of</strong> malt specification which details how malt will performin the brewery. Standard industry measures exist which utilise small scale express fermentation<strong>of</strong> malt extract to determine the percentage <strong>of</strong> extract which can be consumed by yeast duringfermentation. It should be noted however, that the mashing characteristics implemented in thesestandard industry methods is not specific to that used in any particular brewery, and may be thecause <strong>of</strong> poor correlation to actual brewhouse performance. Previous studies have analysed thequantitative variation <strong>of</strong> malt hydrolytic enzymes and other key malt quality parameters. Thishas facilitated improved prediction <strong>of</strong> fermentability through multi linear regression analysis.Commercial experience indicates that despite these recent advances, the difference betweenbrewhouse fermentability and laboratory predicted fermentability is <strong>of</strong>ten varied, resulting inunexpected problems during processing in the brewery.<strong>The</strong> primary objective <strong>of</strong> this study was to increase the understanding <strong>of</strong> factors impacting onfermentability variation. Samples <strong>of</strong> malt with known brewhouse performance data wereanalysed under both standard and novel measures <strong>of</strong> fermentability prediction. Numeroussubstrate biochemical, enzymic and general quality parameters for each malt sample were alsoanalysed to outline their impact on malt fermentability. In addition to the individual impact <strong>of</strong>these factors on malt fermentability, multi linear regression analysis was implemented todetermine the effect <strong>of</strong> confounding parameters on malt extract fermentability.<strong>The</strong> use <strong>of</strong> Rapid Visco Analysis allowed the gelatinisation properties <strong>of</strong> each malt sample to beestablished and compared. Gelatinisation occurs when starch granules are heated in an aqueousmedium, causing granules to swell and burst, releasing linear and branched chains <strong>of</strong>carbohydrate into the surrounding medium. Prior to gelatinisation, the granular structure <strong>of</strong>starch is less susceptible to starch hydrolysis. <strong>The</strong> temperature at which gelatinisation begins tooccur varies in response to starch characteristics that are effected by grain growth conditions.Lower temperatures <strong>of</strong> initial starch gelatinisation allow a greater window <strong>of</strong> opportunity forstarch hydrolysis to occur before thermal inactivation <strong>of</strong> enzymes as mash temperature and mashtime increase.
Environmental stress during barley growth is detrimental to grain development and subsequentgrain quality. Environmental stress during grain development results in decreased grain size andweight, increased levels <strong>of</strong> grain protein and altered starch characteristics <strong>of</strong> the endosperm(Savin and Molina-Cano, 2002). <strong>The</strong> stage <strong>of</strong> plant development during stress and the type /severity <strong>of</strong> a stress will determine the impact <strong>of</strong> environmental conditions on grain quality,together with the varietal resistance to a given stress.Materials:Malt: Eighteen Gairdner variety pale malt samples (Joe White Maltings, Adelaide) wereprovided by Carlsberg Brewery, Kuala Lumpur, Malaysia together with actual brewhouseperformance data.Grain: Eight barley varieties; Baudin, Buloke, Flagship, Gairdner, Schooner, Sloop, Sloop SA,Vlamingh and two unreleased trial varieties; WI 3416-1572 and WI 3586-1747 were grown infive different locations in South Australia: Wanilla, Warooka, Cooke Plains, Salters Springs andAurthurton. <strong>The</strong>se samples were sourced from the 2006 season National Variety Testing (NVT)Program. <strong>The</strong>se grain samples were micromalted under uniform conditions using a Joe WhiteSystems Micromalter (Joe White Malting’s, Adelaide). Two hundred grams <strong>of</strong> each grain sampleunderwent an identical malting program. Grain was steeped at 18 o C for a total length <strong>of</strong> 20hours which was broken into 8 hours immersion in water, 10 hours air rest and 2 hours <strong>of</strong>immersion. <strong>The</strong> grain was then allowed to germinate at 18 o C for a total period <strong>of</strong> 96 hours, withthe grain being watered to increase total mass to 370g after 24, 48 and 96 hours. Gibberellic acidwas also added after 24 hours to increase the rate <strong>of</strong> malt modification due to grain sampleshaving high levels <strong>of</strong> protein resulting from the poor environmental growth season in 2006.Germination <strong>of</strong> grain was halted after 96 hours through a 24 hr kilning program which rampedthe drying temperature from 50 to85 o C.Methods:Malt <strong>Fermentability</strong> Prediction:Method 1- CBKL Mashing Pr<strong>of</strong>ile: <strong>The</strong> mashing protocol utilized a 3:1 water to grist ratio and amashing pr<strong>of</strong>ile specific to that used by CBKL. Three hundred grams <strong>of</strong> double distilled H 2 O(ddH 2 O) was pre-heated to 45 ºC and added to 100g <strong>of</strong> grist, to initiate the mashing process. <strong>The</strong>mash was initially held at 48 ºC for a period <strong>of</strong> 20 minutes, before the temperature <strong>of</strong> the mashwas increased at a maximum rate to 66ºC. After being held at this temperature for a period <strong>of</strong> 45minutes the temperature was again increased at a maximum rate to reach a temperature <strong>of</strong> 72 ºCwhere it was held for a period <strong>of</strong> 10 minutes. After 10 minutes the temperature <strong>of</strong> the mash wasincreased at a maximum rate until the mash reached 76 ºC, before being cooled to 25 ºC. At theconclusion <strong>of</strong> mashing, the sample mass was returned to 650g using ddH 2 O before being filtered.Method 2 – 69 o C Infusion Pr<strong>of</strong>ile: <strong>The</strong> mash bath was preheated to 69 ºC. Fifty grams <strong>of</strong> maltwas deposited into each mash tin and preheated for 30 minutes until it reaches 69ºC. During thepre-heating period, the malt was stirred 5 times every 10 minutes to ensure even heatingoccurred. When malt temperature reached 69ºC (after approximately 30 minutes), 360mL <strong>of</strong> 69ºC ddH 2 O was added. <strong>The</strong> mash is held at this temperature for 60 minutes before cooling to 25ºC. After cooling the contents <strong>of</strong> each mash tin was made up to a final mass <strong>of</strong> 450g by theaddition <strong>of</strong> ddH 2 O, before being filtered.Method 3 – 73 o C Infusion Pr<strong>of</strong>ile: <strong>The</strong> same was method used here as in Method 2 except that a73 o C preheating and mashing temperature are utilised.
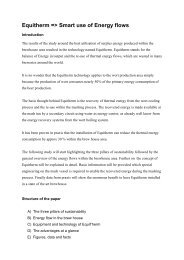
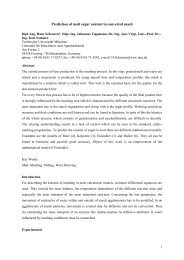
Wort-β-glucan level: <strong>The</strong> total level <strong>of</strong> wort-β-glucan (1-3),(1-4)-β-glucan present in each maltextract sample was measured in triplicate for each individual triplicate mash (total <strong>of</strong> 9 assaysper sample) using the GOPOD method (Megazyme, Ireland).Kolbach Index: <strong>The</strong> Kolbach index (KI) <strong>of</strong> each malt sample was determined by calculating thepercentage <strong>of</strong> total malt protein which can become soluble in the extract during mashing. <strong>The</strong>total level <strong>of</strong> protein in each malt sample and the quantity <strong>of</strong> protein present in the extractproduced from each malt sample was analysed using the Dumas combustion method 8.9.2(Analytica-EBC, 1998).Statistical Analysis: Data was collected and analysed using Micros<strong>of</strong>t Excel SpreadsheetS<strong>of</strong>tware (Micros<strong>of</strong>t, America). Simple Linear regression was carried out through generation <strong>of</strong>scatter plot graphs with subsequent calculation <strong>of</strong> the correlation coefficient. Stepwise multilinear regression analysis was carried out using Genstat 9 th Edition (VSN International ltd, UK)in interactive mode.Results and Discussion:Part 1: Prediction <strong>of</strong> Brewhouse <strong>Fermentability</strong><strong>The</strong> standard industry method for the prediction <strong>of</strong> malt fermentability in the laboratory prior touse in the brewery are set out by the <strong>Institute</strong> <strong>of</strong> <strong>Brewing</strong> (IOB), 1998 and the European <strong>Brewing</strong>Convention (EBC), 1998. While these methods have long been the recognised standards forpredicting malt fermentability, industry feedback highlighted that these methods <strong>of</strong>ten do nothighlight abnormalities in malt prior to its use in the brewery causing production relatedproblems when the end product does not meet predetermined specification limits. This ishighlighted in Figure 2 which shows the fermentability <strong>of</strong> 15 Gairdner variety pale malt sampleswhen predicted using the industry standard EBC method in comparison to actual observedbrewhouse fermentability. With a weak correlation coefficient <strong>of</strong> 0.1057 it is understandable thata more accurate prediction method <strong>of</strong> malt fermentability would be <strong>of</strong> benefit to industry.EBC AAL Vs Brewhouse <strong>Fermentability</strong>8686EBC AAL81768176BrewhouseAAL ResultBrewhouse71716666R2 = 0.1057Figure 2: Comparison <strong>of</strong> standard European <strong>Brewing</strong> Convention (EBC) AAL fermentability vs actualbrewhouse fermentability.<strong>The</strong> mashing (time/temperature) pr<strong>of</strong>ile utilised in the IOB and EBC standard fermentabilityprediction methods is not specific to any particular brewing process. Initially it was hypothesisedthat this was responsible for some <strong>of</strong> the fermentability difference observed between laboratorypredicted and actual brewery fermentability. It was also hypothesised that the harshertemperature conditions employed during large scale mashing in the brewhouse may have alsobeen responsible for the difference between laboratory predicted and brewery fermentability.
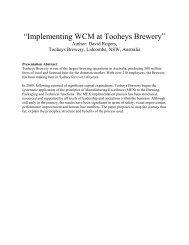
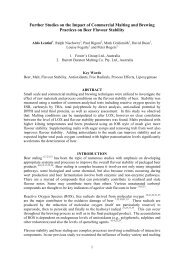
Initially three samples <strong>of</strong> malt were selected with respectively high, medium and low levels <strong>of</strong>known brewhouse fermentability. <strong>The</strong>se samples were analysed using four novel fermentabilityprediction methods and the results <strong>of</strong> this analysis can be seen in Figure 3. Error bars for eachsample represent the standard error <strong>of</strong> triplicate mashes. <strong>The</strong> navy line represents thefermentability <strong>of</strong> each malt sample in the brewery. <strong>The</strong> first trial employed the exact mashingpr<strong>of</strong>ile used by CBKL in the laboratory on a small scale to produce an extract which wasfermented under the regular industry methods for fermentability prediction. <strong>Fermentability</strong> <strong>of</strong> thethree malt samples analysed using this laboratory method can be seen in Figure 3. <strong>The</strong>sefermentability <strong>of</strong> these three samples predicted using this method were correlated well withbrewhouse fermentability (R 2 = 0.7325) but the fermentability predicted using this method wasapproximately 15 % AAL greater then that observed in the brewery and was therefore not furtherinvestigated.To lower the level <strong>of</strong> fermentability levels <strong>of</strong> malt observed in the laboratory to those observedin the brewery, three high temperature infusion mashes were trialed. High temperature infusionmashes place sufficient stress on diastatic enzymes in malt to reduce fermentability. Such hightemperatures <strong>of</strong>ten occur during brewery mashing as a result <strong>of</strong> localised patch heating in themash tun caused by low levels <strong>of</strong> mash agitation, resulting in reduced activity <strong>of</strong> starchdegrading diastatic enzymes.<strong>The</strong> second method employed a 69 o C 60 minute infusion mashing pr<strong>of</strong>ile. <strong>The</strong> fermentability <strong>of</strong>the three malt samples predicted in the laboratory using this method were lower than thoseobserved in method one, but were still 5 % AAL higher then those observed in the brewhouse(R 2 = 90.25). <strong>The</strong> third trial increased mash temperature to 73 o C for 60 min. This methodproduced poor results that were 10% AAL lower then those achieved in the brewhouse. Inaddition, triplicate mashes had a high level <strong>of</strong> standard error and a poor correlation to brewhousefermentability (R 2 = 0.3027). <strong>The</strong> final method trialed a mashing temperature <strong>of</strong> 71 o C. Resultsobtained using this method correlated well with brewhouse fermentability (R 2 = 0.9383), had lowlevels <strong>of</strong> standard error associated with triplicate mashes and had fermentability values close tothose observed in the brewery.Method Vs %AAL90.0085.00%AAL80.0075.0070.00Brewhouse <strong>Fermentability</strong>Brewery Mash Pr<strong>of</strong>ileInfusion 69Infusion 73Infusion 7165.0060.00A B CSampleFigure 3: Percentage fermentability results for each mashing method. Error bars represent standard error <strong>of</strong>triplicate mashes.With the 71 o C infusion mashing pr<strong>of</strong>ile being identified as the best laboratory predictor <strong>of</strong> maltperformance in the brewery, all 18 CBKL malt samples were analysed in triplicate using thismethod. <strong>The</strong> results <strong>of</strong> this analysis can be seen in Figure 4 with the navy line representingincreasing brewhouse fermentability <strong>of</strong> samples and the pink line representing the malt
fermentability predicted using this method. Again, error bars represent the standard errorassociated with the triplicate analysis <strong>of</strong> each sample. Predicted fermentability correlated wellwith that observed in the brewhouse (R 2 = 0.4747), but was however somewhat less reliable thenthat observed in the initial trials.It should be acknowledged that various other parameters such as grist composition, yeast typeand adjunct use, among others, also vary between laboratory and brewhouse prediction methods.While these numerous factors may have an influence on fermentability prediction, this projectwas aimed at predicting malt fermentability without going to the extreme <strong>of</strong> matching everycharacteristic used in the brewhouse. Such a method as this would be difficult for maltsters toimplement on a routine basis due to each <strong>of</strong> their brewing customers having a different process.Part 2: Identification <strong>of</strong> Quality Parameters Affecting <strong>Fermentability</strong><strong>The</strong> enzymic and substrate specific biochemical parameters <strong>of</strong> malted barley largely controlfermentability. <strong>The</strong> diastatic enzymes in the malt are responsible for the hydrolysis <strong>of</strong> starch t<strong>of</strong>ermentable sugars during mashing. <strong>The</strong> three major diastatic enzymes are alpha-amylase, betaamylaseand limit dextrinase. Fluctuation in the levels <strong>of</strong> enzymes has been reported as beingresponsible for differing fermentability (Evans et. al, 2005). <strong>The</strong> thermostability <strong>of</strong> theseenzymes (ie; the percentage <strong>of</strong> enzyme remaining after exposure to high temperature) can also belinked to varying fermentability as less thermostable enzyme activity will result in a lessfermentable extract (Eglinton et. al., 1998). Free Amino Nitrogen in the extract is derived fromdegraded protein in the malted grain. It is utilised as a nutrient by yeast during fermentation andif not present in sufficient concentration may limit extract fermentability. Wort-β-glucan is ameasure <strong>of</strong> the amount <strong>of</strong> undegraded cell wall material in the extract. Whilst this compound isnot fermentable in its natural state, it can be fermented when fully degraded to its building blocksugar units. It is therefore plausible to expect that extracts containing reduced levels <strong>of</strong> wort-βglucanwill contain higher levels <strong>of</strong> fermentable material. Kolbach index (KI) is a measure <strong>of</strong>grain modification during malting expressed as a percentage <strong>of</strong> the total malt protein which canbecome soluble during mashing. Increased KI suggests easier access to starch for hydrolyticenzymes during mashing as more <strong>of</strong> the grains protein matrix will have been degraded. <strong>The</strong>gelatinisation characteristics <strong>of</strong> the malt control the temperature at which the starch is releasedfrom its granular structure for hydrolysis during mashing. <strong>The</strong> peak temperature <strong>of</strong> gelatinisationis the temperature at which a maximum viscosity in the mash is detected (the release <strong>of</strong> starchfrom granules increases mash viscosity). <strong>The</strong> initial temperature <strong>of</strong> gelatinisation is thetemperature at which starch begins to be released from the granules during gelatinisation,signalled by an increase in viscosity from a baseline level.<strong>The</strong> standard malt quality parameters mentioned above were measured in triplicate. Linearregression analysis was used to determine the relationship between brewhouse fermentability andeach malt quality parameter (data not shown). <strong>The</strong> correlation between each malt qualityparameter (as a single variable) and brewhouse fermentability can be found in Table 1. Betweeneach malt sample analysed, differences existed in each malt quality parameter tested.As can be seen in Table 1, the measures <strong>of</strong> total alpha and beta amylase, limit dextrinase andpercentage <strong>of</strong> thermostable beta amylase were all poorly correlated as single variables withbrewhouse fermentability. It should be noted that variation between malt samples for all <strong>of</strong> theseparameters did exist, but as independent variables controlling malt fermentability, only a poorrelationship could be identified. <strong>The</strong> Free Amino Nitrogen (FAN) content <strong>of</strong> each <strong>of</strong> thesesamples was also poorly correlated with brewhouse fermentability. Some variation existedbetween samples, however all samples contained levels <strong>of</strong> FAN which were high enough toensure that yeast nutrition was not affected (Lewis and Bamforth, 2006). Whilst a correlationcoefficient <strong>of</strong> 0.1585 was detected between KI and brewhouse fermentability, this relationshipwas negative, suggesting that some <strong>of</strong> the malt samples may have been over modified resultingin a reduced fermentability.
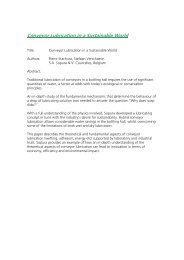
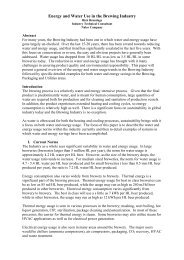
Parameter Correlation (R 2 )Alpha Amylase Activity 0.0133Beta Amylase Activity 0.0128Beta Amylase <strong>The</strong>rmostability 0.0954Limit Dextrinase Activity 0.0061Free Amino Nitrogen Content 0.0113Wort-β-glucan Content 0.0216Kolbach Index 0.1585Initial Starch Gelatinisation Temperature 0.5709Peak Starch Gelatinisation Temperature 0.0707Table 1: Correlation between brewhouse fermentability and standard measures <strong>of</strong> malt quality.<strong>The</strong> initial temperature at which gelatinisation occurs, is a rarely measured parameter <strong>of</strong> maltquality, with the peak temperature <strong>of</strong> gelatinisation being the preferred measurement due toeasier identification, signalled by peak viscosity during exposure to a uniform increase in sampletemperature (Kebler et al., 2005). Rapid Visco Analysis <strong>of</strong> samples using viscosity recordingcomputer s<strong>of</strong>tware enabled the initial temperature <strong>of</strong> gelatinisation to be determined. This valueis potentially more valuable, as gelatinisation <strong>of</strong> starch will occur over a range due to eachgranule having different characteristics. This was seen in this data set with the peak temperature<strong>of</strong> gelatinisation having on a weak negative correlation with brewhouse fermentability (R 2 =0.0707). Initial gelatinisation temperature results for each <strong>of</strong> the 18 samples can be seen inFigure 4. <strong>The</strong>se results indicate a significant negative linear relationship between brewhousefermentability and initial starch gelatinisation temperature, with a correlation coefficient <strong>of</strong> (R 2 =0.5709). This suggests that as a single variable, initial starch gelatinisation temperature directlyaffects malt fermentability. <strong>The</strong> onset <strong>of</strong> gelatinisation <strong>of</strong> starch at a lower temperature providesa greater window <strong>of</strong> opportunity for starch hydrolysis to occur before the key diastatic enzymesare inactivated by high temperatures.Brewhouse <strong>Fermentability</strong> Vs Initial Temperature <strong>of</strong> Gelatinisation<strong>Fermentability</strong> %73.0072.0071.0070.0069.0068.0067.0059.0058.5058.0057.5057.0056.5056.0055.5055.0054.5054.00Temperature oCBREWHOUSEFERMENTABILITYTiFigure 4: Initial temperature <strong>of</strong> starch gelatinisation (Ti) for malt samples in order <strong>of</strong> increasing samplebrewhouse fermentabilityAnalysis <strong>of</strong> the key quality parameters affecting fermentability has highlighted that maltfermentability is not directly controlled by a single parameter. Variation between samples foreach malt quality parameter showed that significant variation does exist. Analysing the differentquality parameters in a multi linear regression approach has been suggested by Evans et al.,(2005) as a superior method to predict malt fermentability. This is based on the recognizedthinking that fermentability is not controlled by a single variable but by interaction betweennumerous interacting variables. Using the calculation method suggested in this previous researchno variation in malt fermentability could be detected (data not shown).
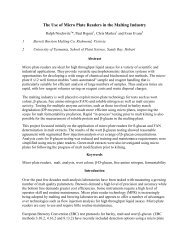
Multi linear regression analysis <strong>of</strong> the results collected in this study found that brewhousefermentability could be predicted using total beta amylase activity, % thermostable beta amylaseactivity, kolbach index and initial temperature <strong>of</strong> gelatinisation. Using these parameters topredict fermentability accounted for 81.7% <strong>of</strong> variation with the standard error <strong>of</strong> observationsestimated to be 0.558%. Here, brewery fermentability <strong>of</strong> the malt samples tested could bedetermined by the equation below.Brewery <strong>Fermentability</strong> = 139.48+0.00495A–0.4071B–0.0995C–1.132D (± 0.558%)Where: A = Total beta amylase activity (U/g)B = % <strong>The</strong>rmostable beta amylase activityC = % Kolbach IndexD = Initial Gelatinisation Temperature ºCPart 3: <strong>The</strong> Impact <strong>of</strong> Environmental Stress on the <strong>Fermentability</strong> <strong>of</strong> Australian Barley Varieties.<strong>The</strong> environment during grain growth has huge potential for altering grain and malt quality. <strong>The</strong>samples tested in this experiment were grown at five sites which varied in rainfall, soil type, soilpH and environmental stresses during growth. <strong>The</strong> data set for this experiment is square, i.e. allvarieties under investigation were grown at all locations. Linear regression analysis was used todetermine the relationship between indicators <strong>of</strong> grain quality and malt fermentability on a siteaverage basis. Grain screenings, plumpness and percentage protein are indicators <strong>of</strong> grain qualityand are directly attributable to the environmental conditions during grain growth. <strong>The</strong>semeasures are used by industry to grade grain to decide its end use. In addition, the previouslydiscussed measure <strong>of</strong> starch gelatinisation temperature is also an indicator <strong>of</strong> grain quality, withincreased plant stress during grain development changing the starch characteristics <strong>of</strong> the grainleading to increased temperature <strong>of</strong> gelatinisation. Figure 5 demonstrates that the mean sitefermentability was different at each <strong>of</strong> the five growth locations. Environmental conditions ateach site were different and thus differences to mean site fermentability can be explained by thedirect effect <strong>of</strong> the environment or through interaction between genotype and environment.Grain screenings is a percentage measure <strong>of</strong> the amount <strong>of</strong> grain which falls below a 2.2mmscreen with a higher percentage indicating increased environmental stress during graindevelopment. Between sites, grain screenings varied by 11%. Linear regression analysis <strong>of</strong> thisdata set determined that grain screenings and brewhouse fermentability had a correlationcoefficient <strong>of</strong> 0.5216. Grain plumpness is an alternative measure <strong>of</strong> grain size and shape whichgives the percentage weight <strong>of</strong> a sample which remains above a 2.5mm screen. Linear regressionanalysis <strong>of</strong> site fermentability and grain plumpness revealed a correlation coefficient <strong>of</strong> 0.2690.Grain protein is a measure <strong>of</strong> the percentage mass <strong>of</strong> the grain made up <strong>of</strong> protein, with morestressful growth environments generally resulting in increased grain protein. Linear regressionanalysis determined that site fermentability and percentage grain protein had a correlationcoefficient <strong>of</strong> 0.2252. In the previous section initial gelatinisation temperature was identified as aimportant parameter impacting on fermentability. It is however a parameter directly affected bygrain growth conditions. When compared using linear regression analysis site fermentability andsite initial gelatinisation temperature had a strong negative correlation (R 2 =0.7769).Multiple linear regression was used to determine that 40.3% <strong>of</strong> variation in site fermentabilitycould be attributed to the site mean grain quality parameters <strong>of</strong> percentage screenings,percentage plumpness, percentage grain protein and initial starch gelatinisation temperature.
ArthurtonCooke PlainsSalters SpringsWanillaWarooka%<strong>Fermentability</strong>Mean Site <strong>Fermentability</strong> Differences861140848280783534Figure 5: Boxplot comparison <strong>of</strong> variation in site fermentability.Part 4: <strong>The</strong> Effect <strong>of</strong> Genotype by Environment Interaction on Malt <strong>Fermentability</strong>.It has been shown in part three that the barley growth environment influences maltfermentability, however while mean site fermentability varied, the variation in the fermentability<strong>of</strong> individual barley varieties grown at the different sites was not constant for each variety. Thissuggests that the genotype <strong>of</strong> a variety modulates the effect <strong>of</strong> environmental conditions on grainquality. This is further illustrated in Figure 6 which shows the variation in fermentability <strong>of</strong> eachvariety grown at each site compared to the mean fermentability at each site. This phenomenon istermed the ‘genotype by environment interaction’ and explains why some varieties produceconsistent quality in varied growth conditions while other varieties produce varied quality barleyin response to different growth conditions (Evans, 2007). Multi linear regression was used todetermine the effect <strong>of</strong> grain quality parameters on sample fermentability. Percentage grainprotein, percentage screenings, percentage plumpness and initial starch gelatinisationtemperature were all used to estimate the effect <strong>of</strong> environmental stress on a plant during growth.<strong>The</strong> combined use <strong>of</strong> these indicators to assess environmental factors allows for greaterpercentages <strong>of</strong> variation in fermentability to be accounted for. Using this method <strong>of</strong> analysis,67.9% <strong>of</strong> variation in fermentability <strong>of</strong> samples could be accounted for by grain qualitycharacteristics when samples were grouped by variety. This demonstrates that environmentalfactors during plant growth impacts on fermentability.While analysis <strong>of</strong> the different individual varieties has revealed details regarding the effect <strong>of</strong>environmental factors on malt, Figure 6 indicates that variation in fermentability betweengrowth sites is similar for some varieties. Varieties were grouped based upon their levels <strong>of</strong>fermentability variation when grown in different environments, to provide a more accurate basisfor examining the relationship between grain quality characteristics and fermentability. <strong>The</strong>segroups were then individually analysed using multi linear regression analysis to determine theeffect <strong>of</strong> environmental factors on each group, as previous multi linear regression analysis hadonly provided the mean level <strong>of</strong> variation accounted for by environmental factors for all samples.
Sample % <strong>Fermentability</strong>88Sample <strong>Fermentability</strong> VS Mean Site <strong>Fermentability</strong>86Variety=WI3586/174784Variety=WI3416/1572Variety=VlaminghVariety=Flagship82Variety=BaudinVariety=BulokeVariety=Sloop SAVariety=Sloop8078Variety=Schooner76Variety=Gairdner8182 838485Mean Site % <strong>Fermentability</strong>Figure 6: Variation in variety fermentability from mean site fermentability.New trial varieties; WI3586-1747 and WI3416-1572 were grouped based on their low levels <strong>of</strong>fermentability variation between the five growth sites. Medium levels <strong>of</strong> fermentability variationbetween sites are observed for Flagship, Baudin, Buloke, Vlamingh, Sloop and Sloop SA andhence these varieties were grouped together. <strong>The</strong> varieties <strong>of</strong> Gairdner and Schooner weregrouped based on the high levels <strong>of</strong> variation in fermentability across growth sites.Multi linear regression <strong>of</strong> the group containing varieties with reduced fermentability variationbetween sites, revealed that 27.9 % <strong>of</strong> the variation could be accounted for by grain qualityparameters. Analysis <strong>of</strong> the grouped varieties with medium levels <strong>of</strong> fermentability variationacross the five growth locations revealed that 57.7% <strong>of</strong> fermentability variation could beaccounted for by indicators <strong>of</strong> grain quality parameters. Finally multi linear regression analysis<strong>of</strong> the grouped varieties with high levels <strong>of</strong> fermentability variation between varieties at differentgrowth sites, revealed that 83.7 % <strong>of</strong> variation could be accounted for indicators <strong>of</strong> grain quality.This suggests that increased variation in fermentability across growth locations can be explainedby decreased resistance to environmental factors.It is important to note that the 2006 growth season was very unsuited to plant growth and thismay be a possible reason for the unusually high variation in genotype fermentability betweengrowth environments. <strong>The</strong> large variation in Gairdner samples fermentability can in partbeexplained by this variety being poorly adapted to most southern Australian productionenvironments. Schooner has a reputation for predictable fermentability that is less affected byenvironmental factors. <strong>The</strong> unusually high levels <strong>of</strong> fermentability between sites can beattributed to poor seasonal conditions. <strong>The</strong> grouping <strong>of</strong> varieties based upon their variation infermentability when grown in different environments identified that different varieties are moresusceptible to environmental conditions then others.
Conclusion:Malt fermentability is influenced by a number <strong>of</strong> interacting parameters. Experimentation withseveral novel mashing pr<strong>of</strong>iles, identified that a 71 ºC infusion mashing pr<strong>of</strong>ile could be used topredict malt fermentability in a specific brewing process. Further investigation highlighted initialstarch gelatinisation temperature as an influencing factor <strong>of</strong> fermentability. It was identified thatgrowth environment influences malt fermentability, through analysing ten different varietiesgrown in five different growth locations. More importantly, genotype and environmentinteraction was highlighted for its role in varying fermentability for different varieties grown indifferent growth locations.Laboratory results provided by Joe White Maltings and brewery data from Carlsberg Breweryindicated that a poor relationship existed between laboratory predicted and breweryfermentability when standard methods <strong>of</strong> analysis were utilised. Four novel methods were trialedin the laboratory and it was identified that a 71ºC infusion mashing pr<strong>of</strong>ile could predictbrewhouse performance with the greatest accuracy. It is hypothesized that at this high mashingtemperature, diastatic enzyme inactivation occurs at a level which is comparable to that which isachieved in the brewhouse, as a result <strong>of</strong> large batch size and low mash agitation. Higherfermentability results obtained using standard methods <strong>of</strong> analysis are expected to be achievedby a far more optimal mashing environment which is carefully controlled. <strong>The</strong> identification <strong>of</strong>this fermentability prediction method which is specific to Carlsberg Brewery, is a majorbreakthrough for Joe White Maltings. This company now has a specific method for determiningthat malt destined for this customer meets the outlined specifications requested. While thismethod does not take into account the numerous other differences between brewery andlaboratory mashing and fermentation conditions such as yeast type and grist composition, it isstill able to predict malt fermentability. A method which did take into account all <strong>of</strong> these otherinfluencing factors would be less suitable for regular use by Joe White Maltings, due to thecomplexity <strong>of</strong> replicating the brewery conditions <strong>of</strong> its numerous customers. Furtherinvestigation could look into how the 71 ºC infusion mash could be used to predictfermentability in other breweries.Numerous malt quality parameters influencing malt quality were measured to determine if theywere responsible for differing malt fermentability in the brewhouse. <strong>The</strong> levels <strong>of</strong> alpha amylase,beta amylase and limit dextrinase enzymes were found to vary between malt batches, but thisvariation did not correlate to variation in brewhouse fermentability. Other malt qualityparameters <strong>of</strong> wort-β-glucan, FAN and KI were also found to vary between samples, howeveragain this variation did not correlate to varying brewhouse fermentability. Finally the initialtemperature <strong>of</strong> starch gelatinisation was identified as being closely correlated to brewhousefermentability. This parameter is a measure <strong>of</strong> the temperature at which starch begins to bereleased from its granular structure for hydrolysis by diastatic enzymes. It is influenced stronglyby plant stress during grain development and hence suggests that measures <strong>of</strong> environmentalstress may be important considerations when predicting malt fermentability.<strong>The</strong> influence <strong>of</strong> environmental conditions on plant stress was investigated for ten varietiesgrown at five locations. <strong>The</strong> effect <strong>of</strong> environmental stress on a sample was determined bylooking at indicators <strong>of</strong> environmental stress; percentage screenings, percentage plumpness,percentage grain protein and initial starch gelatinisation temperature. <strong>The</strong>se four indicators <strong>of</strong>environmental stress were used in multi linear regression analysis to explain 40.3% <strong>of</strong> variationin site fermentability.Environmental conditions were found to affect varieties <strong>of</strong> barley in different ways, with thisbeing translated in both grain and malt quality. As a result it was concluded that the genotype byenvironmental interaction influences both grain and malting quality. When examining sampleson an individual basis, indicators <strong>of</strong> plant stress could explain 67.9 % <strong>of</strong> the variation in
fermentability between varieties. Examining the effect <strong>of</strong> environmental conditions onfermentability variation for different varieties revealed that barley breeders have been successfulover time in reducing the effect <strong>of</strong> environmental conditions on genotype fermentability. Thiswas seen with older varieties displaying increased fermentability variation in response to variedenvironmental conditions, while newer varieties displayed reduced fermentability variation. Thisphenomenon was further examined by partitioning samples <strong>of</strong> varieties into groups based ontheir susceptibility to growth conditions. This identified that susceptibility to environmentalstress was the cause <strong>of</strong> fermentability variation within genotypes.Future research in this area could establish the effect <strong>of</strong> malting conditions on the fermentability<strong>of</strong> varieties grown in different growth environments. In addition, to this the carbohydrate pr<strong>of</strong>ile<strong>of</strong> malt extract could be examined to determine the differences in carbohydrates present in highand low fermentability malts with respect to genotype and environment characteristics.Acknowledgements:<strong>The</strong> Authors would like to acknowledge the financial support <strong>of</strong> Joe White Maltings Pty. Ltd and<strong>The</strong> School <strong>of</strong> Agriculture Food and Wine, <strong>The</strong> University <strong>of</strong> Adelaide. Thanks must go toCarlsberg Brewery, Kuala Lumpur, Malaysia for the provision <strong>of</strong> malt samples and brewhouseperformance data and the South Australian Research and Development <strong>Institute</strong>s NationalVariety Testing Program for the provision <strong>of</strong> grain samples. Thanks must also go to TertiaMcArthur (Joe White Maltings), Stewart Coventry (University <strong>of</strong> Adelaide), Elysia Vassos(University <strong>of</strong> Adelaide) and Philippa Tansing (University <strong>of</strong> Adelaide) for technical assistancewith statistical analysis and the conducting <strong>of</strong> experiments. Special thanks must go the LionNathan Ltd. for providing me the opportunity to present my work at this conference.References:J. K. Eglinton, P. Langridge and D. E. Evans, <strong>The</strong>rmostability Variation in Alleles <strong>of</strong> BarleyBeta-Amylase, Journal <strong>of</strong> Cereal Science, 1998, 28(3), 301-309European <strong>Brewing</strong> Convention, Analytica - EBC, Verlag Hans Carl Getranke Fachverlag,Nurnberg, Germany, 1998E. Evans, H. Collins, J. Eglinton and A. Wilhelmson, Assessing the Impact <strong>of</strong> the Level <strong>of</strong>Diastatic Power Enzymes and <strong>The</strong>ir <strong>The</strong>rmostability on the Hydrolysis <strong>of</strong> Starch During WortProduction to Predict Malt <strong>Fermentability</strong>, Journal American Society <strong>of</strong> <strong>Brewing</strong> Chemists,2005, 63(4), 185-198D. E. Evans, Survey <strong>of</strong> Variation <strong>of</strong> DP and DP Enzymes in Australian and International Malts,Report, University <strong>of</strong> Tasmania, Tasmania, 2007<strong>Institute</strong> <strong>of</strong> <strong>Brewing</strong>, Methods <strong>of</strong> Analysis, London: <strong>Institute</strong> <strong>of</strong> <strong>Brewing</strong>, 1998M. Kebler, M. Zarnkow, S. Kreisz and W. Back, Gelatinisation Properties <strong>of</strong> Different Cerealsand Pseudocereals, Monatsschrift Fur Brauwissenchaft, 2005, September/October Edition 82-88M. J. Lewis and C. W. Bamforth, Essays in <strong>Brewing</strong> Science, Springer Science and BusinessMedia, New York, 2006R. Savin, Molina-Cano, J. L., Changes in Malting Quality and Its Determinants in Response toAbiotic Stress, Food Products Press, New York, 2002