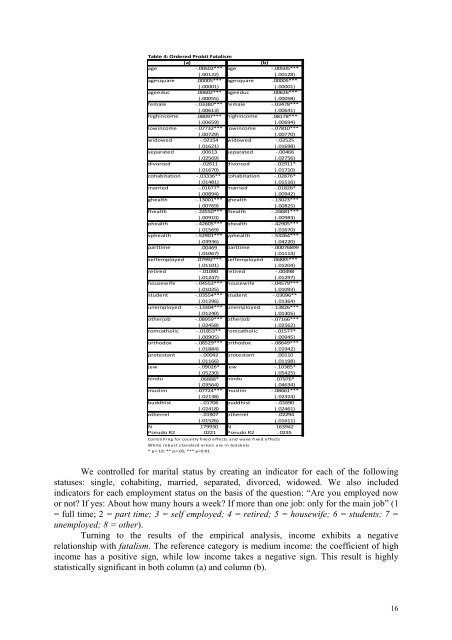
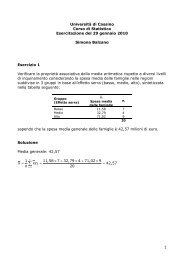
Table 4: Ordered Probit Fatalism(a)(b)age ‐.00502*** age ‐.00505***(.00122) (.00128)agesquare .00005*** agesquare .00005***(.00001) (.00001)ageeduc .00602*** ageeduc .00626***(.00055) (.00058)female ‐.03380*** female ‐.03478***(.00613) (.00641)highincome .08097*** highincome .08178***(.00659) (.00694)lowincome ‐.07732*** lowincome ‐.07810***(.00729) (.00770)widowed ‐.02154 widowed ‐.02525(.01621) (.01698)separated .00613(.02569)separated ‐.00466(.02756)divorced ‐.02611 divorced ‐.02911*(.01670) (.01710)cohabitation ‐.03336** cohabitation ‐.02876*(.01481) (.01516)married ‐.01677* married ‐.01826*(.00894) (.00942)ghealth ‐.13001*** ghealth ‐.13023***(.00769) (.00825)fhealth ‐.24550*** fhealth ‐.24681***(.00910) (.00983)phealth ‐.42605*** phealth ‐.42905***(.01569) (.01670)vphealth ‐.52901*** vphealth ‐.53264***(.03936) (.04220)parttime .00469(.01067)parttime ‐.00076899(.01114)selfemployed .07992*** selfemployed .06885***(.01101) (.01204)retired ‐.01090 retired ‐.00498(.01247) (.01297)housewife ‐.04553*** housewife ‐.04579***(.01025) (.01093)student ‐.03554*** student ‐.03096**(.01296) (.01364)unemployed ‐.13304*** unemployed ‐.13826***(.01240) (.01305)otherjob ‐.08959*** otherjob ‐.07166***(.02458) (.02562)romcatholic ‐.01853** romcatholic ‐.01577*(.00905) (.00945)orthodox ‐.08529*** orthodox ‐.08649***(.01884) (.01942)protestant ‐.00042 protestant .00110(.01166) (.01198)jew ‐.09026* jew ‐.10385*(.05230) (.05425)hindu.06888* hindu.07976*(.03564) (.04634)muslim ‐.07724*** muslim ‐.08661***(.02138) (.02324)buddhist‐.01706 buddhist ‐.01690(.02418) (.02461)otherrel‐.01907 otherrel ‐.02294(.01526) (.01611)N 179930 N 163942Pseudo R2 .0221 Pseudo R2 .0235Controlling for country fixed effects <strong>and</strong> wave fixed effectsWhite robust st<strong>and</strong>ard errors are in brackets* p
As regards education, the coefficient of ageeducation takes a positive sign <strong>and</strong> ishighly significant. Hence when education increases, so too does the probability of being anon-fatalistic person. This supports our hypothesis that education can weaken the linkbetween transmitted culture <strong>and</strong> <strong>beliefs</strong> <strong>and</strong> make individuals more inclined to believe thatthey have greater control over life-events (this result holds in both samples). Unfortunately,we are unable to establish a causal link from education to fatalism because a higher level ofeducation may reflect an higher level of unobserved ability possessed by an individual, so thatthe decrease in fatalism may be caused by the individual’s higher skills. 11 Perhaps educationplays a role in this case, too, given that the technology of skill formation is characterized bystrong complementarities between cognitive skills <strong>and</strong> non-cognitive traits (Cuhna <strong>and</strong>Heckman, 2007) such as fatalism. Education improves people’s skills, <strong>and</strong> it may makeindividuals more aware of their abilities <strong>and</strong> therefore less fatalistic. To be on the safe side,we merely state that there is strong evidence for a negative relation between fatalism <strong>and</strong>education.Also the relation between health <strong>and</strong> fatalism takes the expected sign. The referenceclass is ‘very good health’: a worsening in the perceived state of health is accompanied by anincrease in fatalism.The effect of employment status also has the expected sign. Individuals who declarethat they are self-employed are less likely to be fatalistic (the reference category is full-timeworkers), while the probability of being fatalistic increases for housewives, unemployedpersons, <strong>and</strong> students. We are aware that the latter result may be due to reverse causality. Bydefinition, a non-fatalistic individual is someone who thinks that s/he has control over his/herlife, so that it is reasonable to assume that it is the latter attitude which influences the decisionto undertake self employment, <strong>and</strong> not vice-versa.Also gender plays a role in fatalistic attitudes, with women being more likely tobelieve that life-events are beyond their control. Of course, this can be rationalized in variousways mostly reliant on the impact of culture <strong>and</strong> education. Unfortunately, still today womenin many countries are far from being emancipated, <strong>and</strong> values transferred through culture <strong>and</strong>education tend to strengthen an antiquated vision of the female’s role. Hence, it is possiblethat this attitude towards women has generated a feeling of ‘resignation’. Indeed, thisinterpretation is to some extent supported by the sign of the coefficient of housewives.The analysis also suggests the existence of a non-linear relationship (reverse U-shaped) between age <strong>and</strong> fatalism: younger <strong>and</strong> older people seem to be less fatalistic.Finally, as far as religions are concerned, people declaring that they belong to areligion show a higher probability of being fatalistic. In particular, being ‘Orthodox’,‘Muslim’, ‘Jewish’ or ‘Catholic’ is positively correlated with the probability of beingfatalistic (with the first two results strongly statistically significant in both columns). Thesecond result is well known in sociology. The coefficients relative to ‘Protestant’ <strong>and</strong>‘Buddhist’ 12 take positive signs but are not statistically significant. The sign of ‘Hindu’ islikely to be due to problems with the Indian sample, because in the 1989-93 wave the samplewas designed so that 90 percent of respondents were literate (compared to a populationaverage of less than 50 percent). 13 Note that these signs are in line with the results obtainedby Algan <strong>and</strong> Cahuc (2006b).11 See Griliches (1977) <strong>and</strong> Card (2001) for a discussion on the ability bias.12Probably, the effect of Buddhist affiliation is captured by the dummy relative to Japan. Algan <strong>and</strong> Cahuc(2006b) report that Buddhist affiliation is almost perfectly correlated with Japan.13 In 1999-2004, the survey was designed to be representative of 97% of the population. However, in this casetoo, no sample weights were provided.17